Chapter 18 — Make Investment Analysis Part of Your Daily Routine
Investing is itself a highly information-dense, strongly structured, judgment-dependent activity: financial reports you can't finish reading, industries you can't untangle, bulls and bears that won't stop arguing. And organizing fragmented info, breaking down complex material, putting the thinking process on the table — is exactly what AI is good at.
In one complete stock-research pass, what low-quality repetitive labor can AI take off your hands, returning energy to judgment itself.
First Be Clear: What Should AI Do in Investing
Most people's image of "AI trading" is having it predict ups and downs. But from real high-frequency use, the vast majority of valuable prompts cluster on four things:
- Financial reports I can't finish — summarize them for me;
- The industry is too complex — walk me through the logic;
- The market is too noisy — put the bull/bear views in one table;
- I fear I'm kidding myself — find me counter-evidence.
None of these are "predict the price"; they all reduce low-quality thinking time. AI's most sensible place in investing is a tireless, emotionless, on-call research assistant — it builds the factual base and leaves the judgment to you.
Like the office suite, before starting, set the bar for this research with five questions. Much "AI analysis is bad" stems not from the model's inability to analyze, but from the person not stating the research goal clearly.
| Question | What to make clear | Example |
|---|---|---|
| Goal | What decision this research supports | Whether to add a stock to the watchlist, or to decide adding/cutting now. |
| Target | Which company, which industry | Tianfo Communication (300394), optical comms / CPO sector. |
| Material | Which are sources of truth, which are reference | Annual report, Q3 report, broker research are truth; forum views are sentiment reference only. |
| Depth | Just fact-tidying, or down to valuation and bull/bear reasoning | First build the fact base (Prompts 1–3), then due-diligence-level DeepResearch (Prompt 8). |
| Acceptance | How to judge the result usable | Every judgment traces to a data source; facts and opinions marked separately. |
Pick the Right Tools First: The Finance-Scene Skill Combo
Before the prompts, meet a few Skills used in this chapter. They divide labor differently, can be used alone, or chained like a pipeline.
| Skill name | Good for | How used here | Watch out |
|---|---|---|---|
stock-advisor | End-to-end analysis of one stock | Upload a screenshot or give a code; auto-runs technical, fundamental, cross-validation, private-board, layout | Main line of this chapter; detailed in sections 3–4 |
a-share-analyst | A-share daily market & stock picking | Real-time quotes, technicals, quant screening, daily report | Leans daily watching & batch screening |
financial-expert | Financial-data query & screening | Stock picking, fund screening, financial metrics, macro/industry time series, broker-research retrieval | Depends on a data-source MCP; configure first |
peers-advisory-group | Multi-perspective decision discussion | Four "advisers" cross-debate one topic | Called by stock-advisor as the decision module |
A practical pairing idea: for daily watching and batch screening use a-share-analyst and financial-expert; for a deep single-stock full report use stock-advisor; when you need to escape a single viewpoint and force yourself to see the flip side, call in peers-advisory-group.
From Looking Up Material to Making a Call: A Reusable Research Prompt Chain
This section is pure prompts. They go simplest → relatively complex, covering the full chain from "look up material" to "make a call". You don't have to use every one — first build the fact base with the first three, then go further when you need depth. Prompt 8 is the "all-in-one" that compresses all prior steps into one framework, and the most-used one in daily DeepResearch on ChatGPT, Gemini, Doubao, Qwen.
The usage is uniform for each: replace the placeholder in
【】brackets with your target, paste and run.
Prompt 1 | The Basics: Build a "Fact Base" for the Company
Scene it solves: just met a company — don't rush to judge; first figure out what it actually does. Many wrong calls start at step one with a misread of the business — you think it makes money from A, but profit mainly comes from B. This step's value is compressing the time cost of "getting the facts clear".
Help me systematically lay out the basics of 【XXX Company】 and output a structured summary, including:
1) Core business and main product lines
2) Revenue and profit source composition
3) Main customers and use scenarios
4) The company's position in the industry chain
5) The most important strategic changes in recent years

## Requirements:
- Use only verifiable info
- 3–5 bullet points per section
- No investment advice; fact-organizing only
Prompt 2 | Industry View: Is This a "Good Industry"
Scene it solves: an often-underestimated problem in stock research — you're often picking an industry, not a company. AI is well-suited to a "first-principles" industry pass. But industry turning points, price bottoms — don't expect it to answer those.
From an industry-research angle, analyze the 【<XXX industry>】 that 【<XXX company>】 is in:
1) The cycle stage the industry is in (recovery/expansion/decline/depression)
2) Supply-demand and main drivers
  - Capacity, utilization, inventory, order/delivery cycle
3) Price-change mechanism and historical volatility
  - Product price index/spread/cost pass-through
  - Capex: Capex trends, expansion projects, new industry capacity
4) Industry concentration and competitive landscape
5) Key external variables affecting the industry (policy, tech, macro)
  - Policy & external: rates, FX, regulation, subsidies, trade limits
Clearly mark: which are long-term structural factors, which are short-term波动 factors. Output cycle-stage judgment + key-evidence chart list + 3 leading indicators and 3 lagging indicators.
Prompt 3 | Business Breakdown: How Exactly Does It Make Money
Scene it solves: the key step from "looking at a company" to "looking at a business". Many "looks-beautiful" companies have fragile core profit sources. Mixed companies (main business A, profit from B) are especially good for AI to help you see clearly.
From a 【value-investing / fundamental-research】 angle, do a "business breakdown" of 【XXX Company】, aiming to answer one core question:
👉 What does this company 【truly, long-term】 make money from?

## Requirements
- Based only on verifiable info (annual reports, prospectuses, periodic announcements, investor-meeting minutes, authoritative industry reports)
- Clearly separate 【fact】 from 【judgment】; every judgment must give evidence or a logic chain
- Output as a structured Markdown report

## Required structure
I. One-sentence conclusion on the company's "way of making money"
- Summarize the core money-making logic in under 50 words (sell what → to whom → why it can profit)

II. Full business-structure breakdown (must quantify)
1. Business-segment split
   - List all core businesses / product lines / service lines
   - For each: revenue share, gross margin, growth trend (last 3–5 years)
2. Profit-source judgment
   - Which businesses "contribute most of the profit"
   - Which businesses "have big revenue but don't make money / even lose money"
   - Is there a 【main business ≠ profit core】 situation? (e.g. main A, profit from B)

III. Money-making mechanism breakdown (Business Engine)
For each core business answer:
- How is money collected? (one-off/subscription/recurring/ project-based)
- Where does cost mainly go? (raw material, labor, channel, R&D, marketing)
- What decides gross margin? Structural advantage or cyclical dividend?
- Is there scale effect? As scale grows, which cost gets diluted?

IV. Customers, channels and pricing power
- Who are the core customers? Concentration? (Top5/Top10 customer share)
- Sales-channel structure (direct / dealer / platform / government / big-client)
- Pricing power? Historically successful price raises? Evidence?
- How high is the customer's cost to switch suppliers? Why?

V. Subsidiaries / associates / non-recurring business
- List important subsidiaries, associates and their business nature
- Clarify which profit comes from:
  - sustainable operations
  - cyclical swings
  - investment income / policy subsidies / asset disposal
- Judge how this "non-main profit" affects long-term valuation logic (positive / negative / noise)

VI. "Stability and fragility" of the business model
- Which assumptions, if broken, invalidate the money-making logic?
- Which part is most easily hit by competition / tech / policy?
- Summarize with 3–5 "key monitoring metrics" how to keep verifying this business still holds

## Final output
- One-sentence business-essence summary
- Business-structure table (revenue / profit / gross margin)
- Money-making mechanism logic chain (text + bullets)
- The 3 judgment conclusions most important to a long-term investor
Prompt 4 | Financial Quality: Is the Money Earned Clean
Scene it solves: financial-research metrics are many; here's a general format. The core is forcing a "profit vs cash flow" cross-check — pretty book profit with cash flow lagging is often the first warning.
Analyze the financial quality of 【<company>】 over recent years:
1) Matching of revenue, profit and operating cash flow
2) Changes in receivables, inventory, contract assets
3) Impact of non-recurring gains/losses on profit
4) Whether there are one-off items or accounting-scope changes
5) Financial-risk points worth focused tracking

## Research principles
- Don't predict the stock price; judge financial "quality" only
- Force a "profit vs cash flow" cross-check
- Every anomaly must give an explanatory hypothesis and a verification path

Highlight: which metrics are worth continuous tracking.
Prompt 5 | Equity & Governance: Is the Boss on the Same Boat as You
Scene it solves: good business + poor governance = high-volatility risky asset. Pledged shares, reductions, related-party transactions, incentive clauses — this "chip-side" info is scattered; AI can tidy it into a timeline and risk radar in one pass.
1. Lay out the equity structure and key shareholders of 【<company>】:
- Actual controller, controlling shareholder, board structure
- Pledge ratio and changes, reduction plans, potential control-change risk
- Related-party transactions, horizontal competition, fund-occupation risk
Output: governance-structure diagram (text is fine) + risk radar (high/med/low) + announcement list to track.

2. Build a "chip-event timeline" for 【<company>】 over the next <12 months>: lock-up expiry, ESOP unlocks, private placement/rights issue, buyback progress.
For each: potential sell-pressure / absorption-capacity judgment, impact path on the valuation center, historical price reaction to similar events (if findable).

3. Analyze 【<company>】 management pay and equity incentives:
- Are the incentive metrics easy to "window-dress"? (revenue/profit/cash flow/ROIC)
- Target difficulty vs industry
- Are there short-term-behavior incentives (chasing revenue, cutting R&D, etc.)
Output: alignment conclusion + key-clause excerpts + improvement suggestions.
Prompt 6 | Market Divergence: What Are Bulls and Bears Arguing About
Scene it solves: bull and bear views carry the most info. This step doesn't tell you who to believe — it flattens the divergence so you see what data to watch next to verify.
Lay out the market's main points of divergence on 【XXX company】:
1) Core bull logic
2) Core bear logic
3) Each side's most important evidence
4) Which divergences can be verified by future data
5) What the key verification nodes are

## Analysis requirements
- Don't take a side
- No investment advice
- No emotional or stance-laden language
- Every judgment must be verifiable by future data or events
Prompt 7 | Valuation & Moat: What Assumption Is the Market Betting On
Scene it solves: moat and valuation are two unavoidable blocks in value investing. One rates moat strength; one builds a DCF to back out the market's implied expectations.
Analyze the moat of 【<company>】 from a value-investing angle; must cite company disclosures / authoritative sources.
1) Pricing power: over <5–10 years> gross-margin / price-raising / cost pass-through evidence?
2) Switching cost: what does it cost a customer to switch suppliers (system, process, compliance, ecosystem)?
3) Network effect / scale effect: how does scale lower unit cost or improve experience?
4) Intangible assets: brand, patents, licenses, data, channel barriers — verifiable evidence?
5) Competitive response: how do main rivals attack, how does the company defend (historical battles)?
Output: moat-strength score (0–5) + evidence table + the most-likely-eroded point and monitoring metrics.Build a DCF valuation for 【<company>】 (public financial data allowed; must cite sources):
- Clarify WACC/discount-rate assumptions and basis
- Forecast 5–10-year free cash flow: revenue, margin, reinvestment rate
- Give a sensitivity table (discount × terminal growth, or discount × margin)
- Back out: the revenue-growth / margin path implied by current market cap
Output: valuation range + key-assumption list + the 2 assumptions most likely wrong and a verification plan.Prompt 8 | The All-In-One: A Due-Diligence-Level DeepResearch
Scene it solves: this compresses the logic of the prior seven steps into one framework — an "investor due-diligence report". It forces separating fact from judgment, cross-verification, and bear-logic & black-swan reasoning — to fight the "confirmation bias" humans fall into most. Works well in DeepResearch mode across AI vendors.
I need you to complete an investor due-diligence report. The goal is a full business-model, financial-quality, industry-cycle and valuation-logic reasoning pass on the target `<stock name/code>`.
Please reason strictly along the framework below.

## Constraints & Standards (research principles)
1. Data timeliness & span: financials should cover the last 3–5 years of trends (CAGR); valuation percentiles should look back 5–10 years of history.
2. Fact base first: separate 【Fact】 from 【Opinion】. Every judgment must rest on verifiable data (annual reports, prospectuses, regulatory inquiry letters).
3. Double verification: do a "profit vs cash flow" cross-check and a "company vs peer" comparison.
4. Counter-intuitive thinking: must include "bear logic" and "black-swan risk" reasoning, to avoid confirmation bias.

## Research Context (user input)
- **Research target**: [enter stock name/code here]
- **Investing style**: [e.g. value / growth-handoff / turnaround]
- **Holding horizon**: [e.g. medium-long 1–3 years]

## Workflow
### Phase 1: Business-model & moat breakdown (Business Engine & Moat)
> Core task: figure out what it really makes money from; strip noise; see the essence.
1. Business透视 and purification:
    - **Break down revenue/profit structure**: what's the core business? Is there "main business drums up attention, side business (investment/subsidy) makes profit"?
    - **Subsidiary/associate穿透**: dig into the real contribution of major subsidiaries and associates; **strip noise**; clearly state which businesses drag, which are hidden gold mines.
2. Moat determination:
    - **Pricing power**: able to raise prices? (evidence: does gross margin move with cost? can it pass cost through?)
    - **Core barrier**: brand premium, very high switching cost, network effect, or pure low-cost advantage?
    - **Industry ceiling**: how big is the TAM? current share distribution? has the company hit the growth ceiling?

### Phase 2: Industry cycle & supply-demand landscape (Industry Context)
> Core task: tailwind or headwind; red ocean or blue ocean.
1. Cycle positioning: which stage is the industry in (recovery/overheating/stagflation/decline/depression)? Cite inventory, utilization, Capex trends as evidence.
2. Supply-demand scissors: find "leading" and "lagging" indicators. Will large new capacity come online in the next 1–2 years?
3. Competitive-landscape change: is concentration (CR5) rising or dispersing? What big moves have main rivals made recently (price war / tech breakthrough)?

### Phase 3: Financial-health & quality mine-sweep (Financial Health)
> Core task: is this money earned clean? Is the growth quality?
1. Core-metric trends:
    - Compute 3–5-year **revenue CAGR** and **net-profit CAGR**; judge growth persistence.
    - Analyze **ROE** drivers (DuPont: leverage, or turnover, or margin?).
    - Plot **gross & net margin** trends; judge profit-stability.
2. Anomaly check (mine-sweep):
    - Turnover alerts: inventory turnover, receivables-days deteriorating (lengthening)?
    - Gold-content test: operating cash flow / net profit matched? (long-term <1 = danger).
    - Non-recurring: excluding one-off gains, is adjusted net profit still healthy?

### Phase 4: Governance structure & capital allocation (Governance & Allocation)
> Core task: is management a partner to shareholders or a harvester?
1. Capital-action review:
    - Inventory issuances, buybacks, equity incentives or major M&A in the last 2 years. Did these **thicken EPS** or **dilute** minority interests?
2. Equity & chips:
    - Controller's share? **High-pledge** risk? Any important shareholders (big funds / execs) continuously reducing?
3. Management portrait:
    - Do their words and deeds match?
    - **Capital-allocation ability**: historically, where did earned money go (bad investment / expansion / dividend / buyback)? ROIC?

### Phase 5: Valuation logic & risk anti-fragility (Valuation & Risk)
> Core task: does the price bake in too-high expectations?
1. Relative valuation (vertical + horizontal):
    - **Historical percentile**: where is current PE/PB/PS in the 5–10-year history?
    - **Peer comparison**: vs main rivals, premium or discount? Well-founded?
2. Absolute valuation (reverse thinking):
    - Don't just forecast; do a **reverse DCF**: what 3–5-year net-profit growth does the current price imply? Is this implied expectation too optimistic?
3. Risk & bear logic:
    - **Bear view**: search the web for core short-sell reasons (short reports / negative sentiment).
    - **Black swan**: policy/regulatory risk, tech-path-disruption risk, geopolitical risk.

## Output Format
Output structured, and append a 【source-citation list】 at the end:
1. Investment-conclusion summary
    - Signal rating: 🟢buy / 🟡watch / 🔴sell
    - Core-logic summary (one-liner)
2. Key financial-data table (incl. CAGR, ROE, cash-flow match)
3. Deep-analysis body (per the 5 phases above; each conclusion with data support)
4. Valuation dashboard (historical percentile + implied expectation + peer comparison)
5. Future monitoring checklist
    - Only when [event A] happens, strengthen the buy logic.
    - Once [data B] deteriorates (e.g. gross margin drops below X%), the logic is falsified — exit immediately.
Here, a prompt chain from "look up material" to "make a call" is complete. But you may have noticed a problem — they're loose. For every new stock you must re-paste each one, hand-feed the previous step's conclusion to the next, and finally assemble the report yourself. The next section packages this chain into one Skill.
From Prompts to a Skill: How stock-advisor Grew
The Pain in This Scene
The prompts in the last section are each good alone, but to fully research one stock, the pain is clear:
- Manual chaining: technical, fundamental, bull/bear, valuation — eight prompts to run, hand-carrying intermediate conclusions around;
- Re-do per target: every new stock re-runs the whole flow;
- Data by eye: numbers in screenshots checked by human, easy to misread;
- Decision prone to self-confirmation: one person analyzing, hard to escape their stance;
- Delivery by hand: organizing it into a decent report is another round of manual labor.
stock-advisor solves exactly this — turning the chain from "a pile of prompts" into "one-click pipeline that runs to completion".
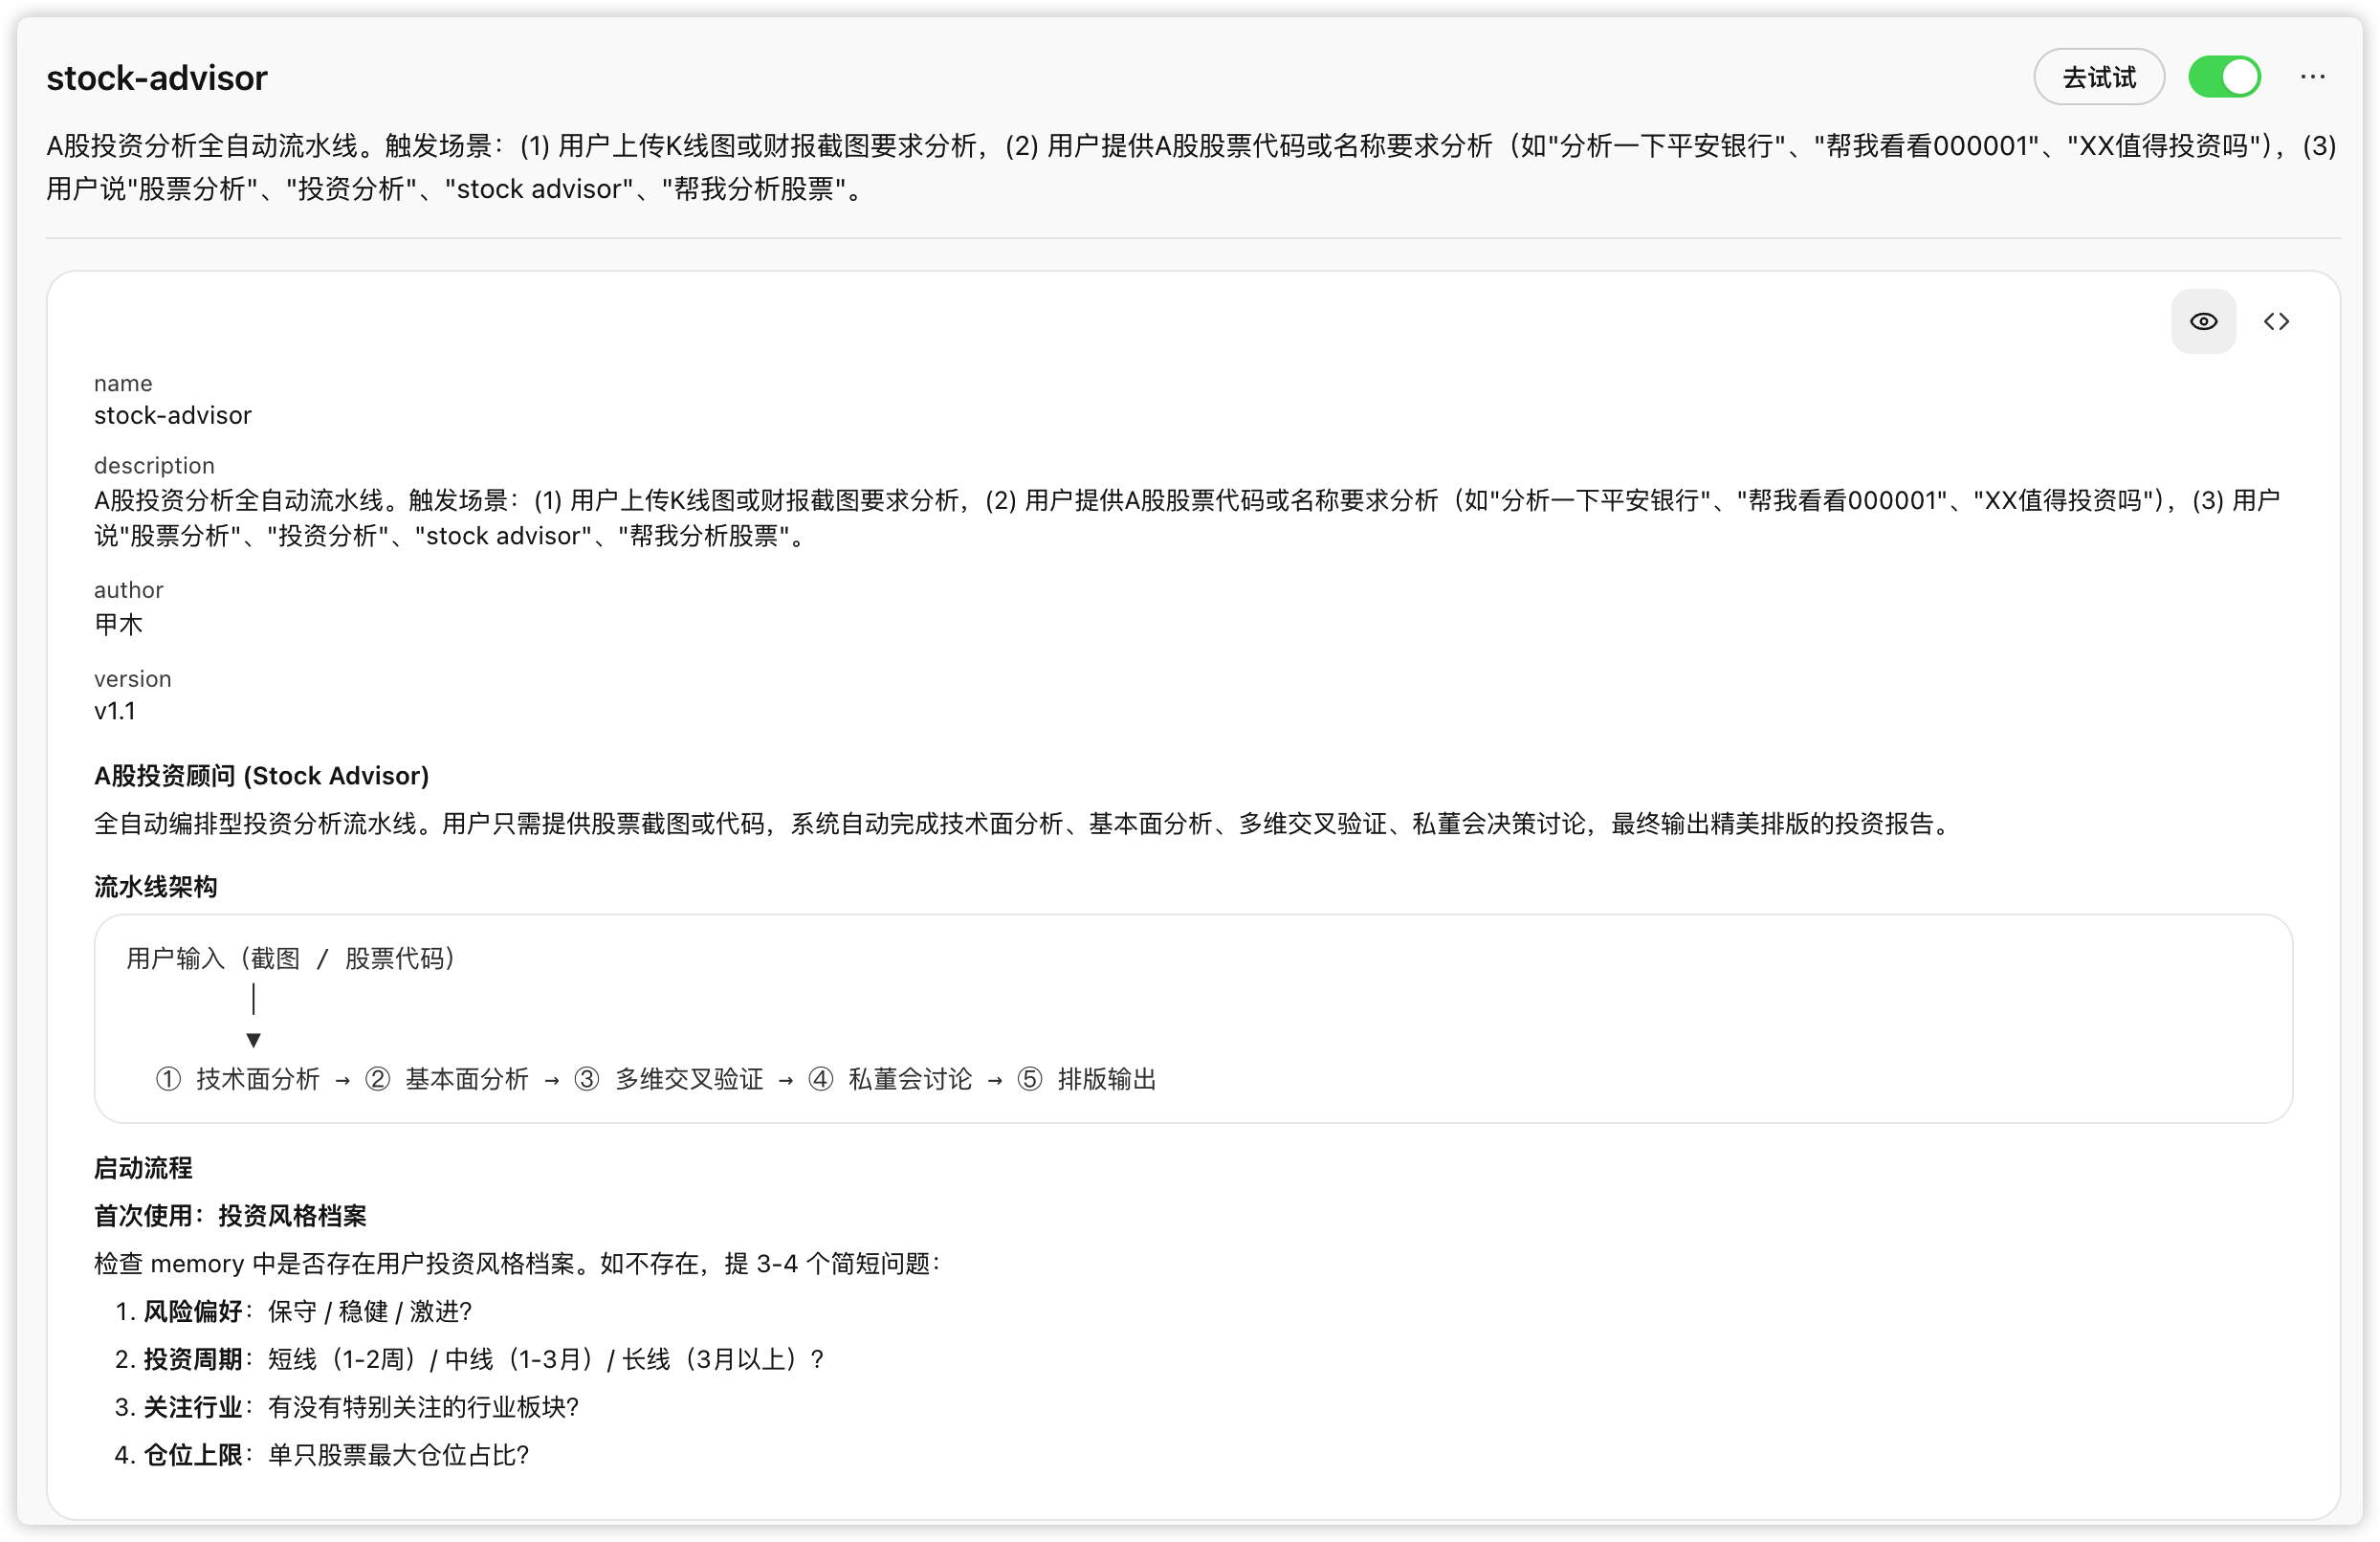
Design Principle: Orchestrate, Don't Rewrite
The core of stock-advisor is one word — Orchestration. It didn't rebuild every capability; it chained "already-good parts" in order into a pipeline:
User input (screenshot / stock code)
        │
        ▼
  ① Technical → ② Fundamental → ③ Multi-dim cross-validation → ④ Private board → ⑤ Layout output
Five modules each doing their job:
| Module | What it does | Key design |
|---|---|---|
| ① Technical | Read forms, MAs, MACD from the K-line; cross-verify with quote data | Image-recognition + data dual-track; on conflict, data wins and the diff is flagged |
| ② Fundamental | Read key financial metrics; add valuation & industry comparison; give a composite rating | Technical / fundamental / money-flow each scored, then合成 a rating |
| ③ Multi-dim cross-validation | Search research reports, industry dynamics, major news, policy | On conflicting signals (e.g. technical bullish but research bearish) must flag the divergence |
| ④ Private board | Call peers-advisory-group; four advisers cross-debate this stock | Reuse an existing Skill; institutionalize "finding counter-evidence" |
| ⑤ Layout output | Tidy into a structured report, magazine-style HTML / PDF, uploadable to Feishu | Reuse magazine-layout and lark-doc |
Here hides the most learnable point of Skill creation: reuse, not rewrite. stock-advisor's dependency list reuses a-share-analyst for technical scripts, peers-advisory-group for decision discussion, magazine-layout for layout, lark-doc for upload. What it newly wrote itself is only a few blocks like "fundamental analysis" and "HTML-to-PDF".
In other words, building a complex Skill doesn't have to mean writing a giant from scratch. Treat existing capabilities as building blocks, fill the missing ones, then orchestrate them on one main line — that's
stock-advisor's creation method, and the general idea for distilling personal experience into a tool.
It also has two small "productization" touches:
- Profile on first use: the first run asks 3–4 questions (risk preference, horizon, focus industries, position cap), saved to memory; later advice weights by your style;
- Two entries, one pipeline: upload-screenshot goes "image recognition + data validation"; give a code goes "pure-data driven"; the diff is only in data fetching, identical after.
What Problem It Solves
In one line: compress "one serious stock study" from half a day of manual work into one conversation. You supply a screenshot or code; it auto-does data fetching, multi-aspect analysis, cross-validation, multi-view debate and report layout. What the human does shifts from "hauling and splicing" to "calling the shot and questioning" — exactly what section 1 said: return energy to judgment.
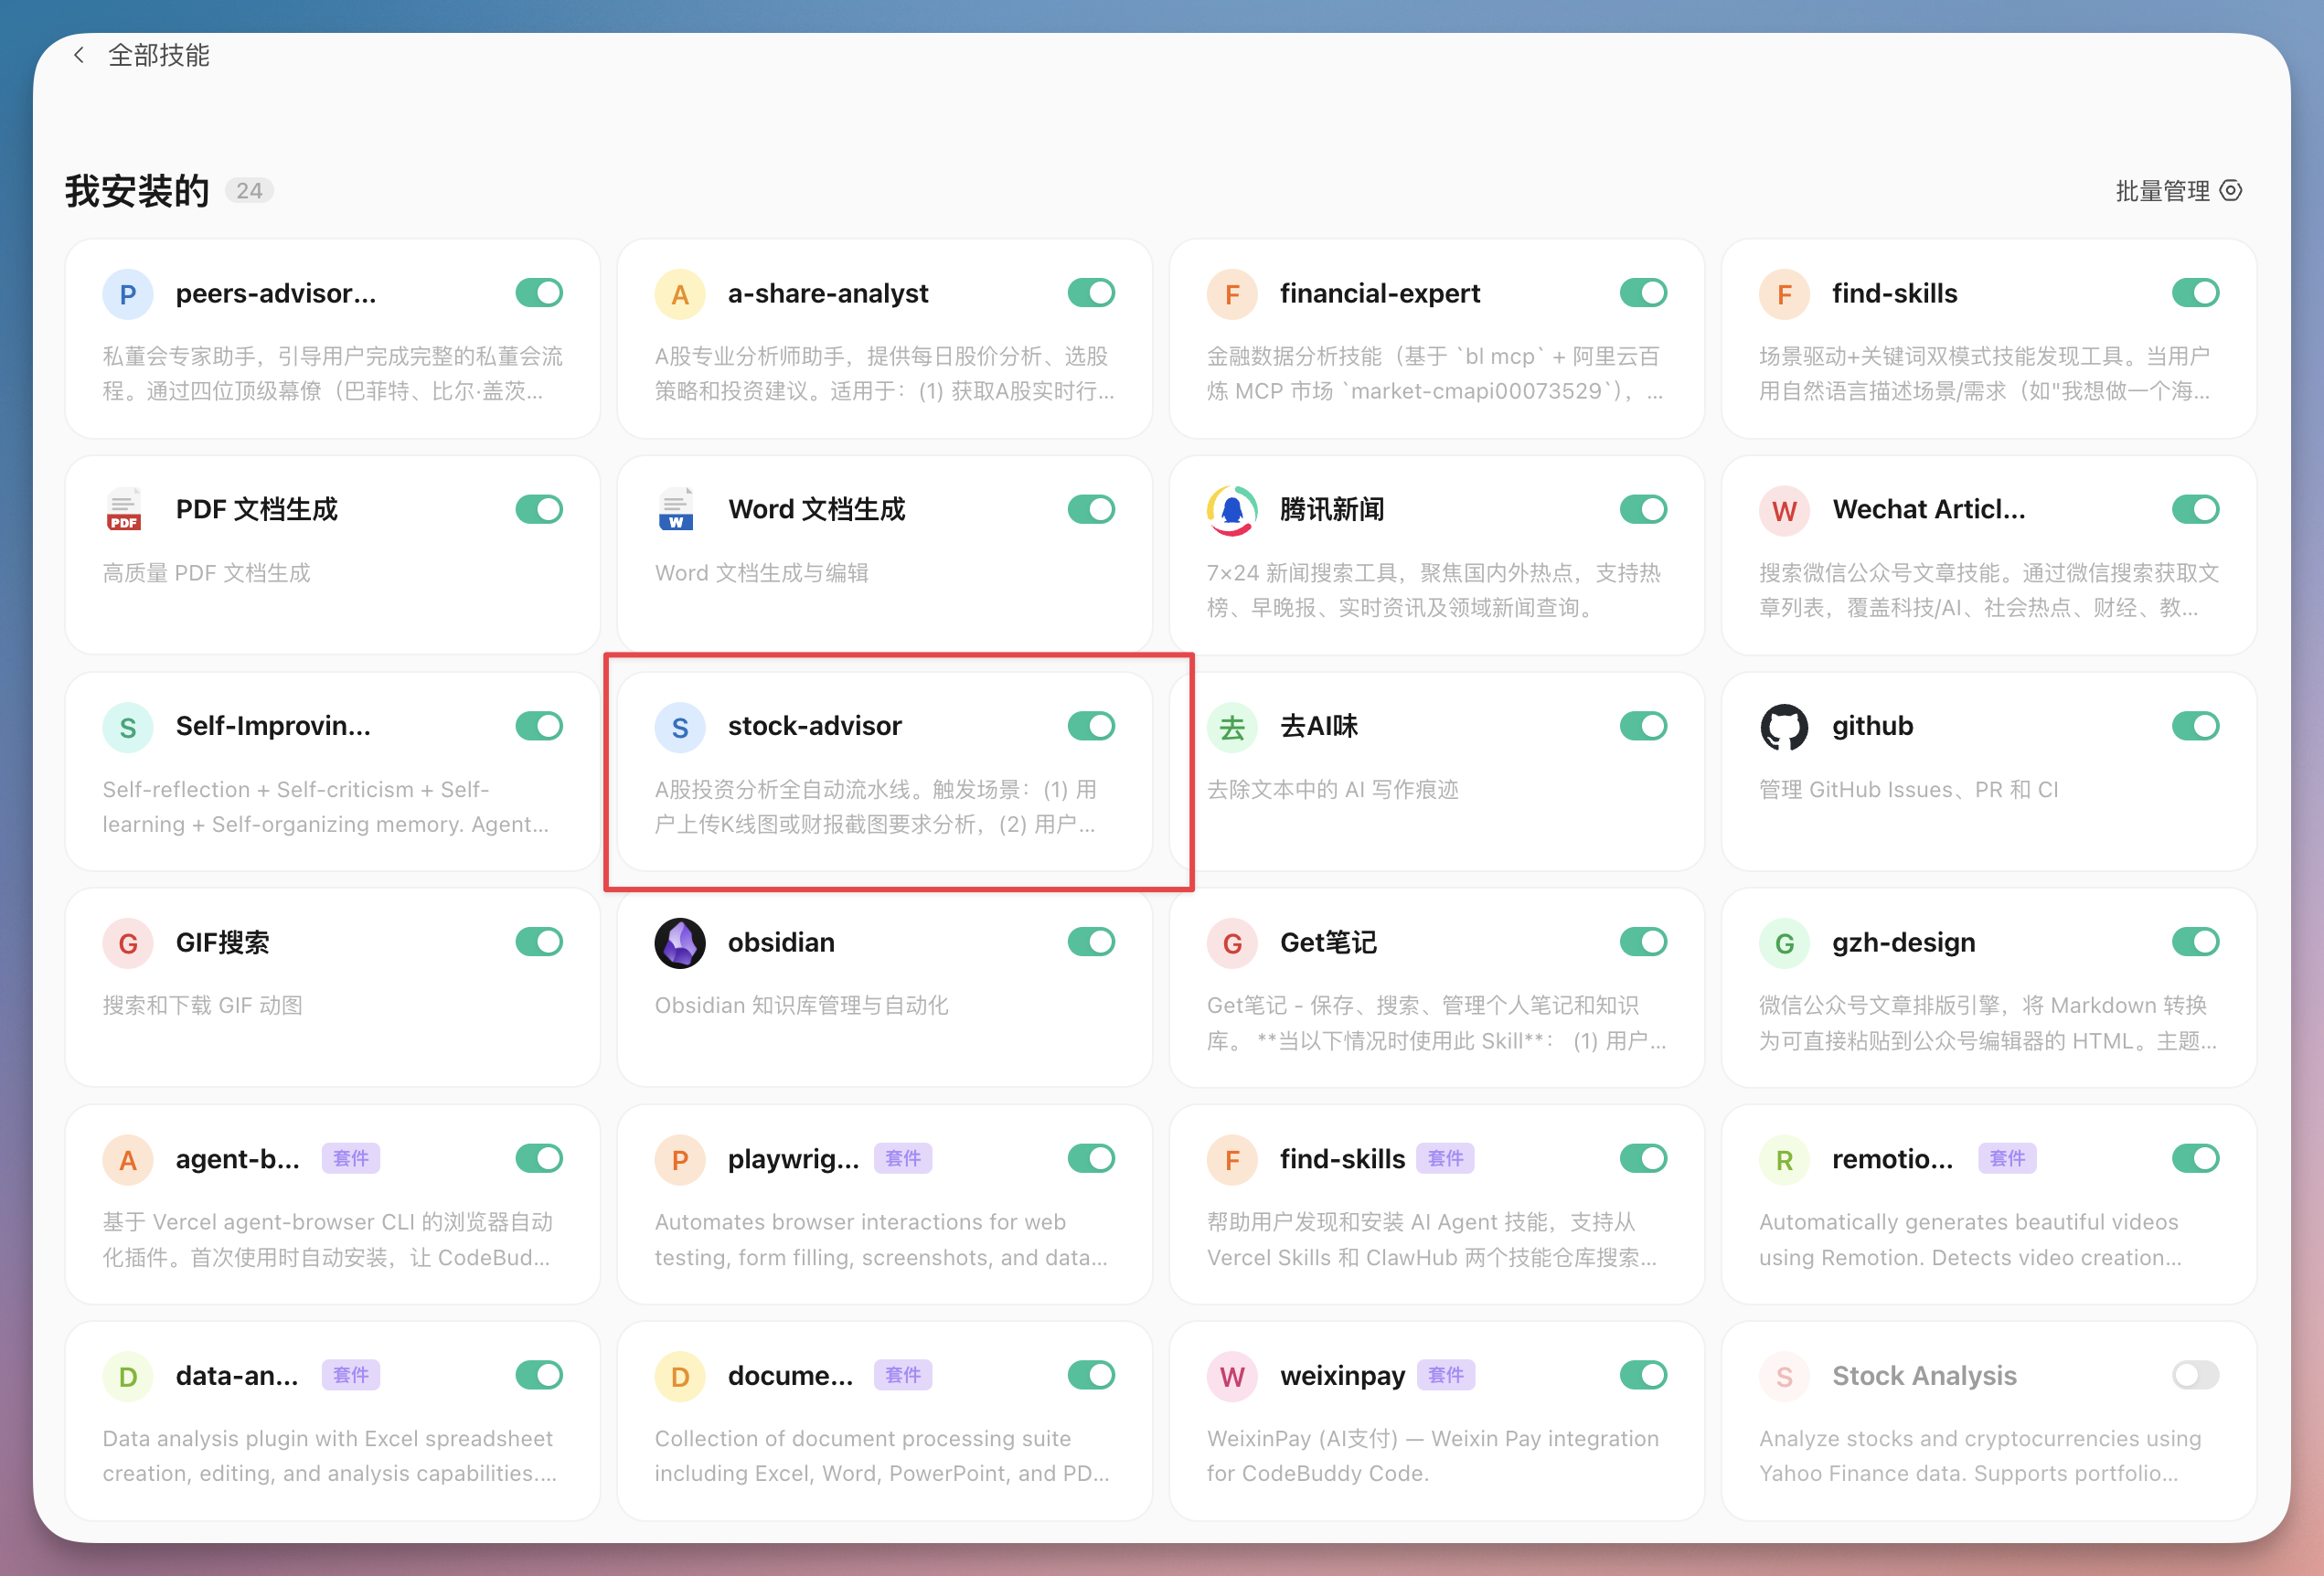
The interface triggering the
stock-advisorSkill in WorkBuddy (the moment the skill is recognized and starts executing).
Live Case: Run stock-advisor on Tianfo Communication (300394)
Principle isn't enough; below is a real, complete conversation. The target is Tianfo Communication (300394), optical comms / CPO. The whole process advances in three steps: read the chart, read the financials, hold a private board.
Step 1: Upload the K-line; First a Technical Quick-Read
I uploaded this stock's daily K-line and MACD charts and had it do technical analysis first. The prompt is the hands-on version of section 2's idea:
I've uploaded an A-share daily K-line chart and a technical-indicator chart (MACD). As a professional technical analyst, complete:
1. Identify stock info: which stock? Approximate current price?
2. K-line form analysis: recent form? Specific last-5-day K-line behavior?
3. MA analysis: arrangement of MA5/MA10/MA20, any golden/death cross recently?
4. MACD analysis: DIF–DEA position, histogram trend, any divergence?
Output a technical quick-read as table + text.
The conversation interface uploading the K-line + entering the prompt above.
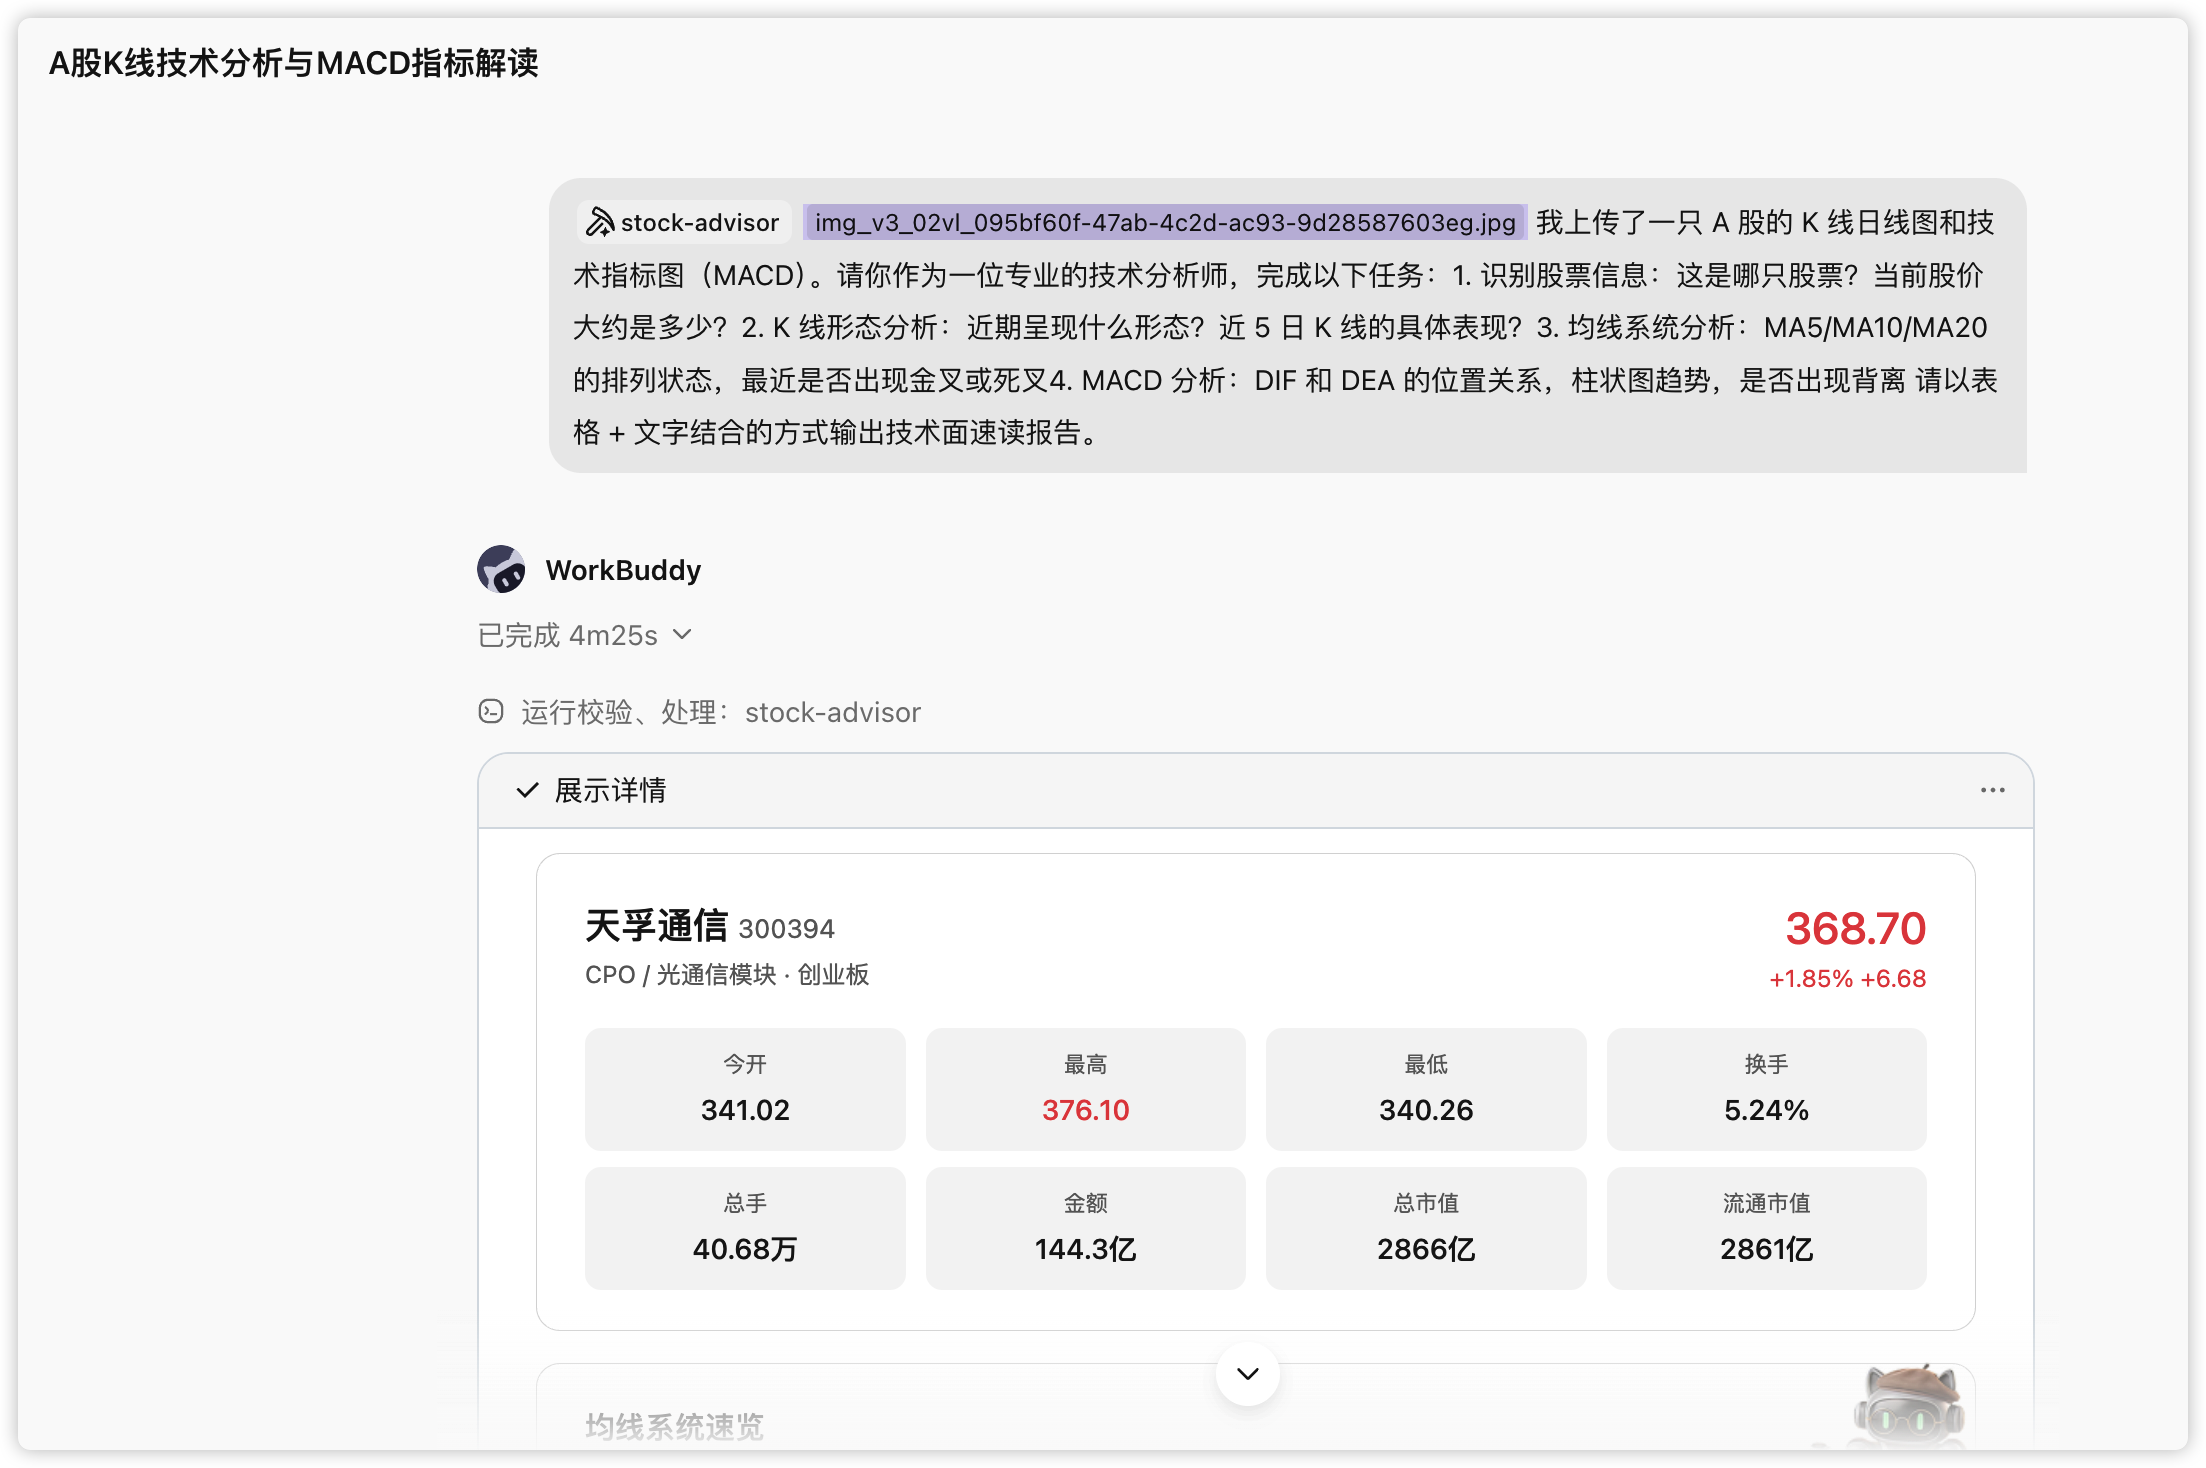
WorkBuddy first recognized this as Tianfo Communication (300394), current price ~368.70 RMB, then gave a structured technical quick-read. Core conclusions:
- Trend: MA5 > MA10 > MA20, a standard bullish stack, no death cross, still in the main uptrend;
- Risk signal: a long upper shadow that day (pushed to 376.10 then fell back to 368.70), MACD red bars starting to shorten, large deviation;
- Key levels: support at MA5 (347) / MA10 (319); resistance at the day's high 376.
The full technical quick-read output (four small tables: K-line form, MAs, MACD)
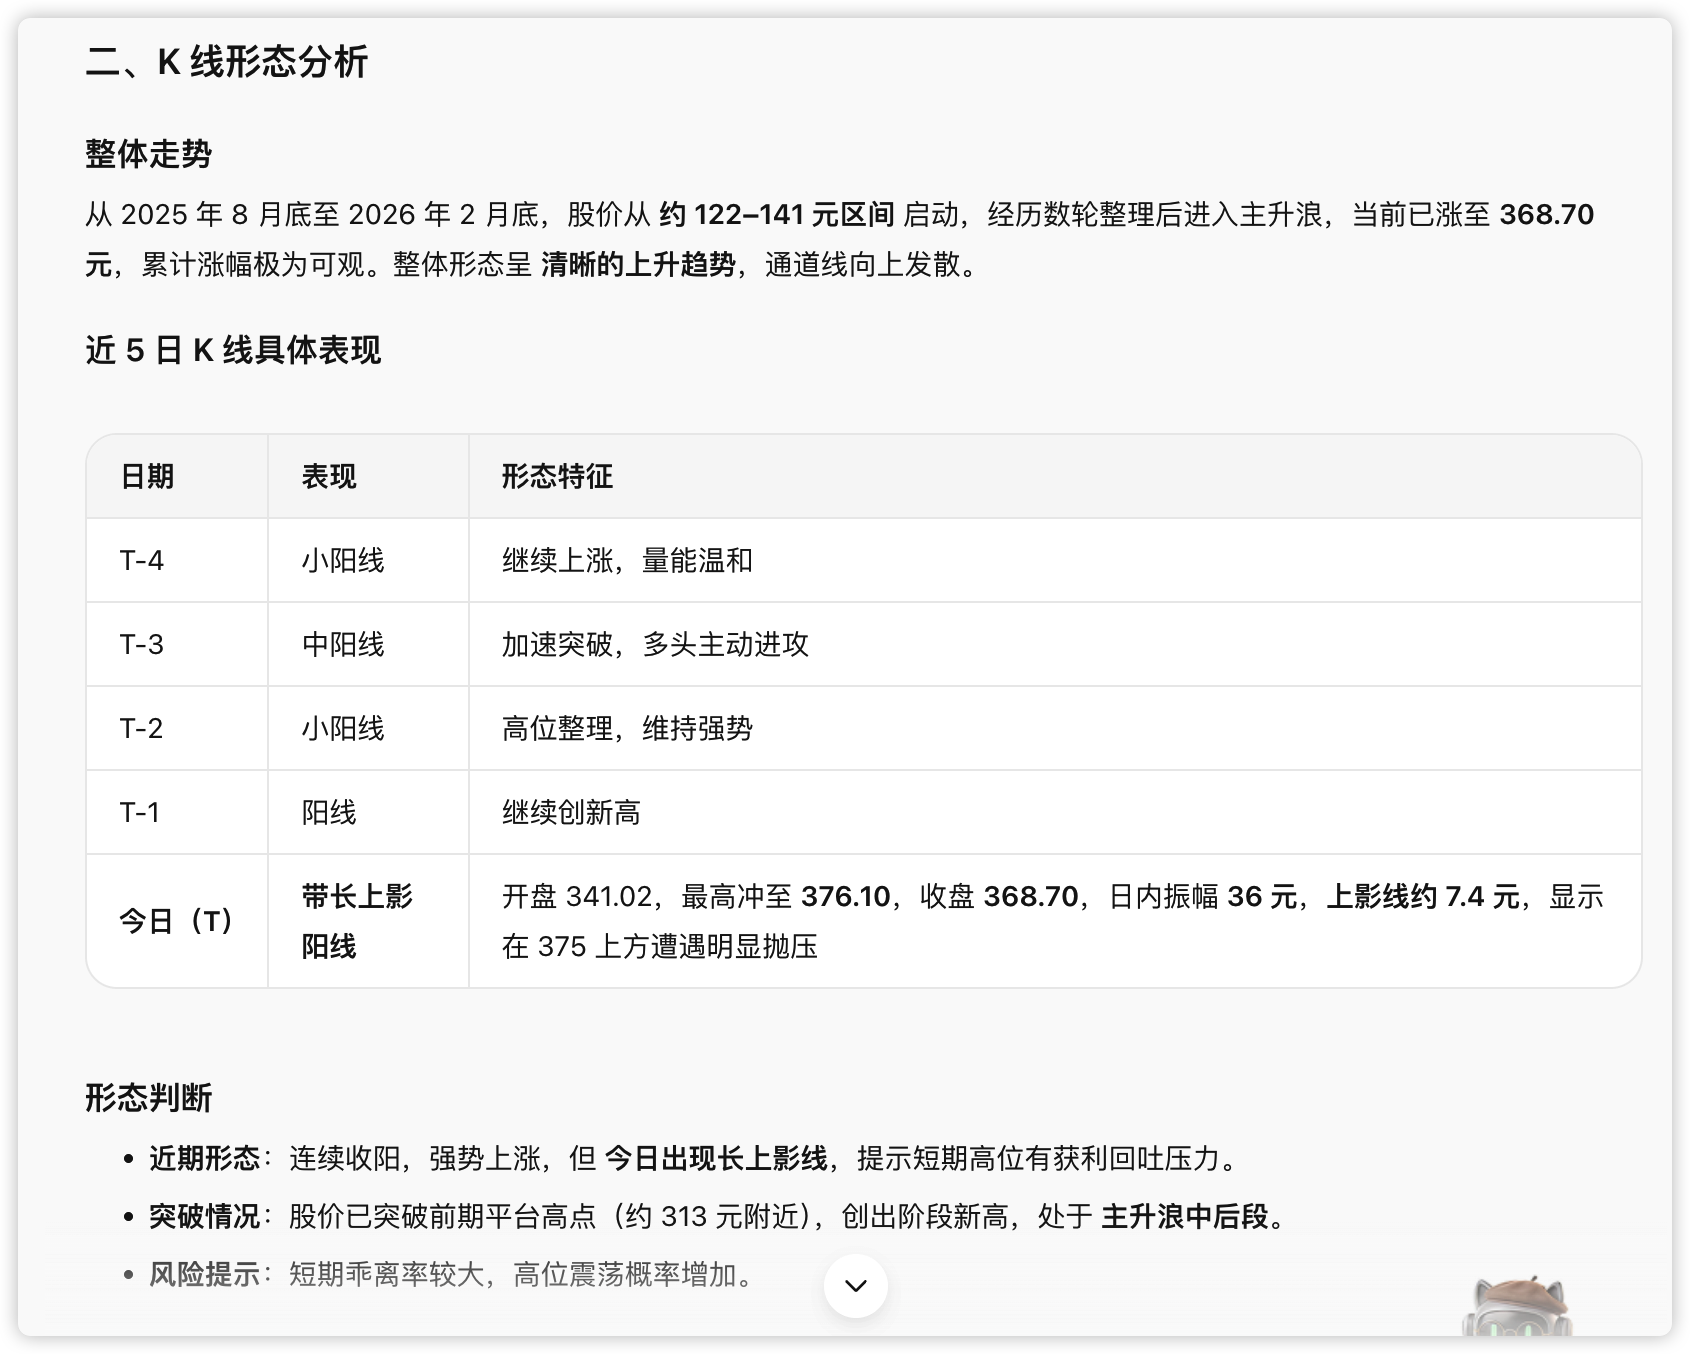
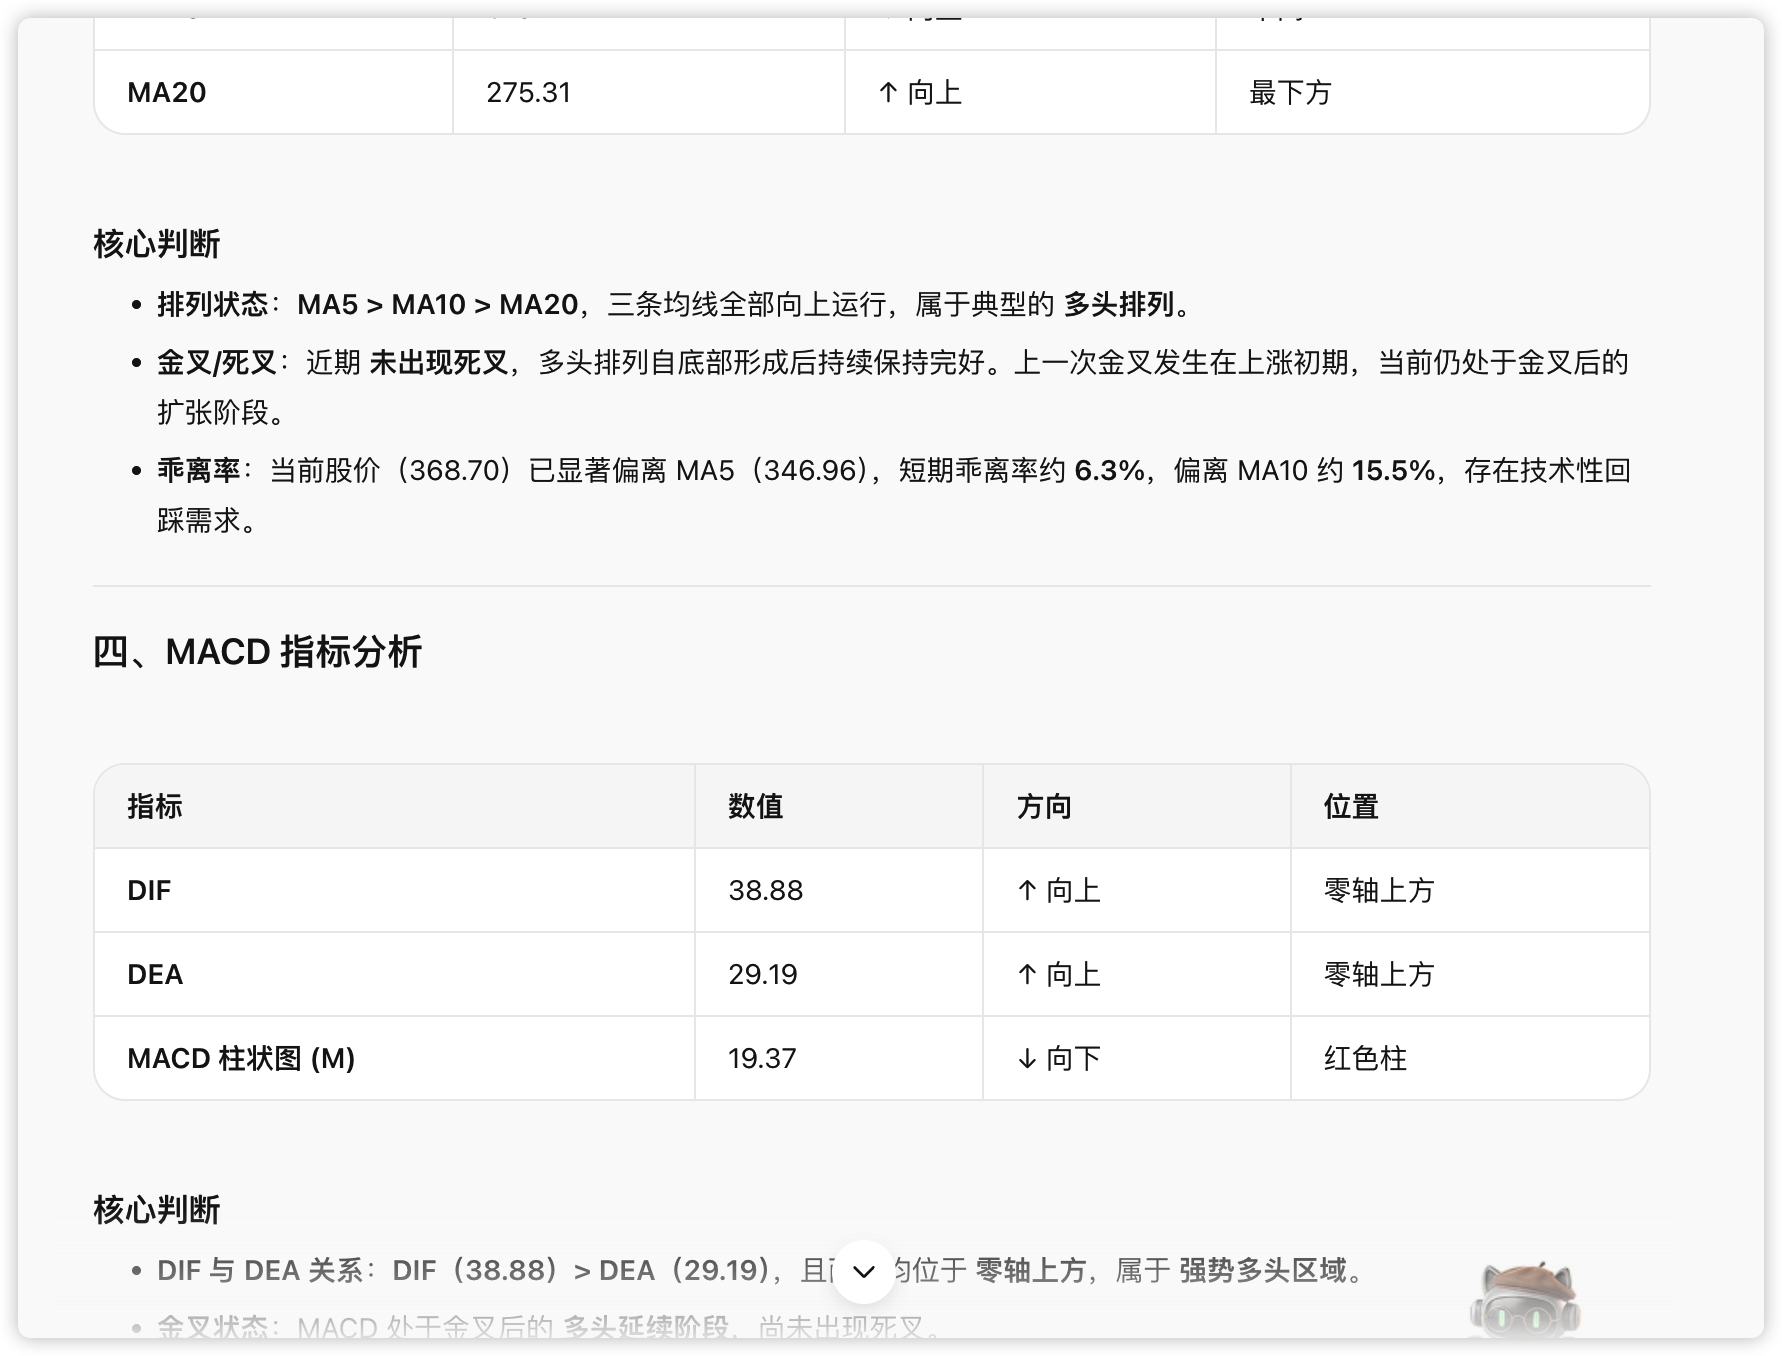
One-line take: this step didn't guess the price — it structured "the facts readable from the chart": form, MAs, indicators, support/resistance, all clear.
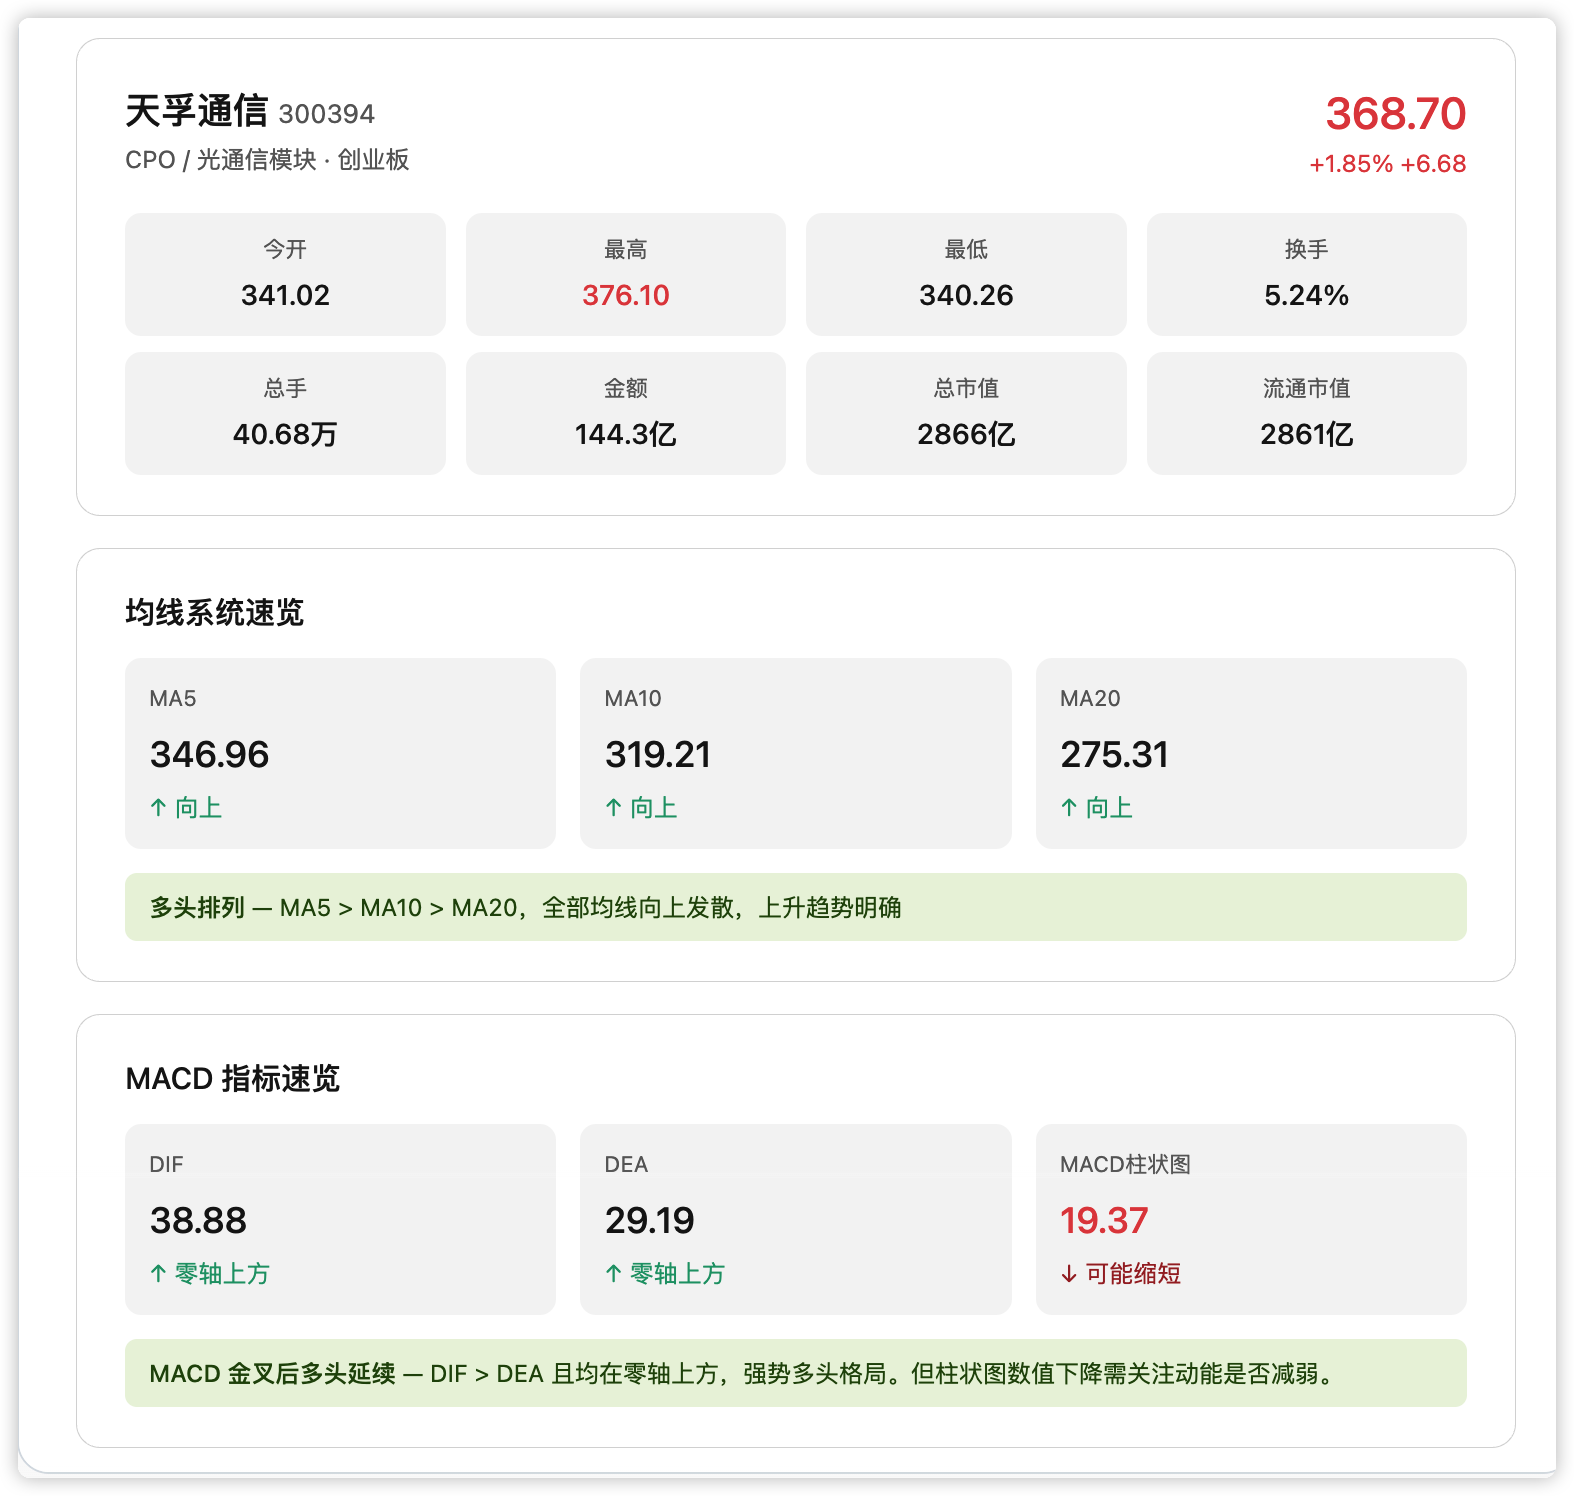
Step 2: Add Financial Screenshots; Do a Full Analysis
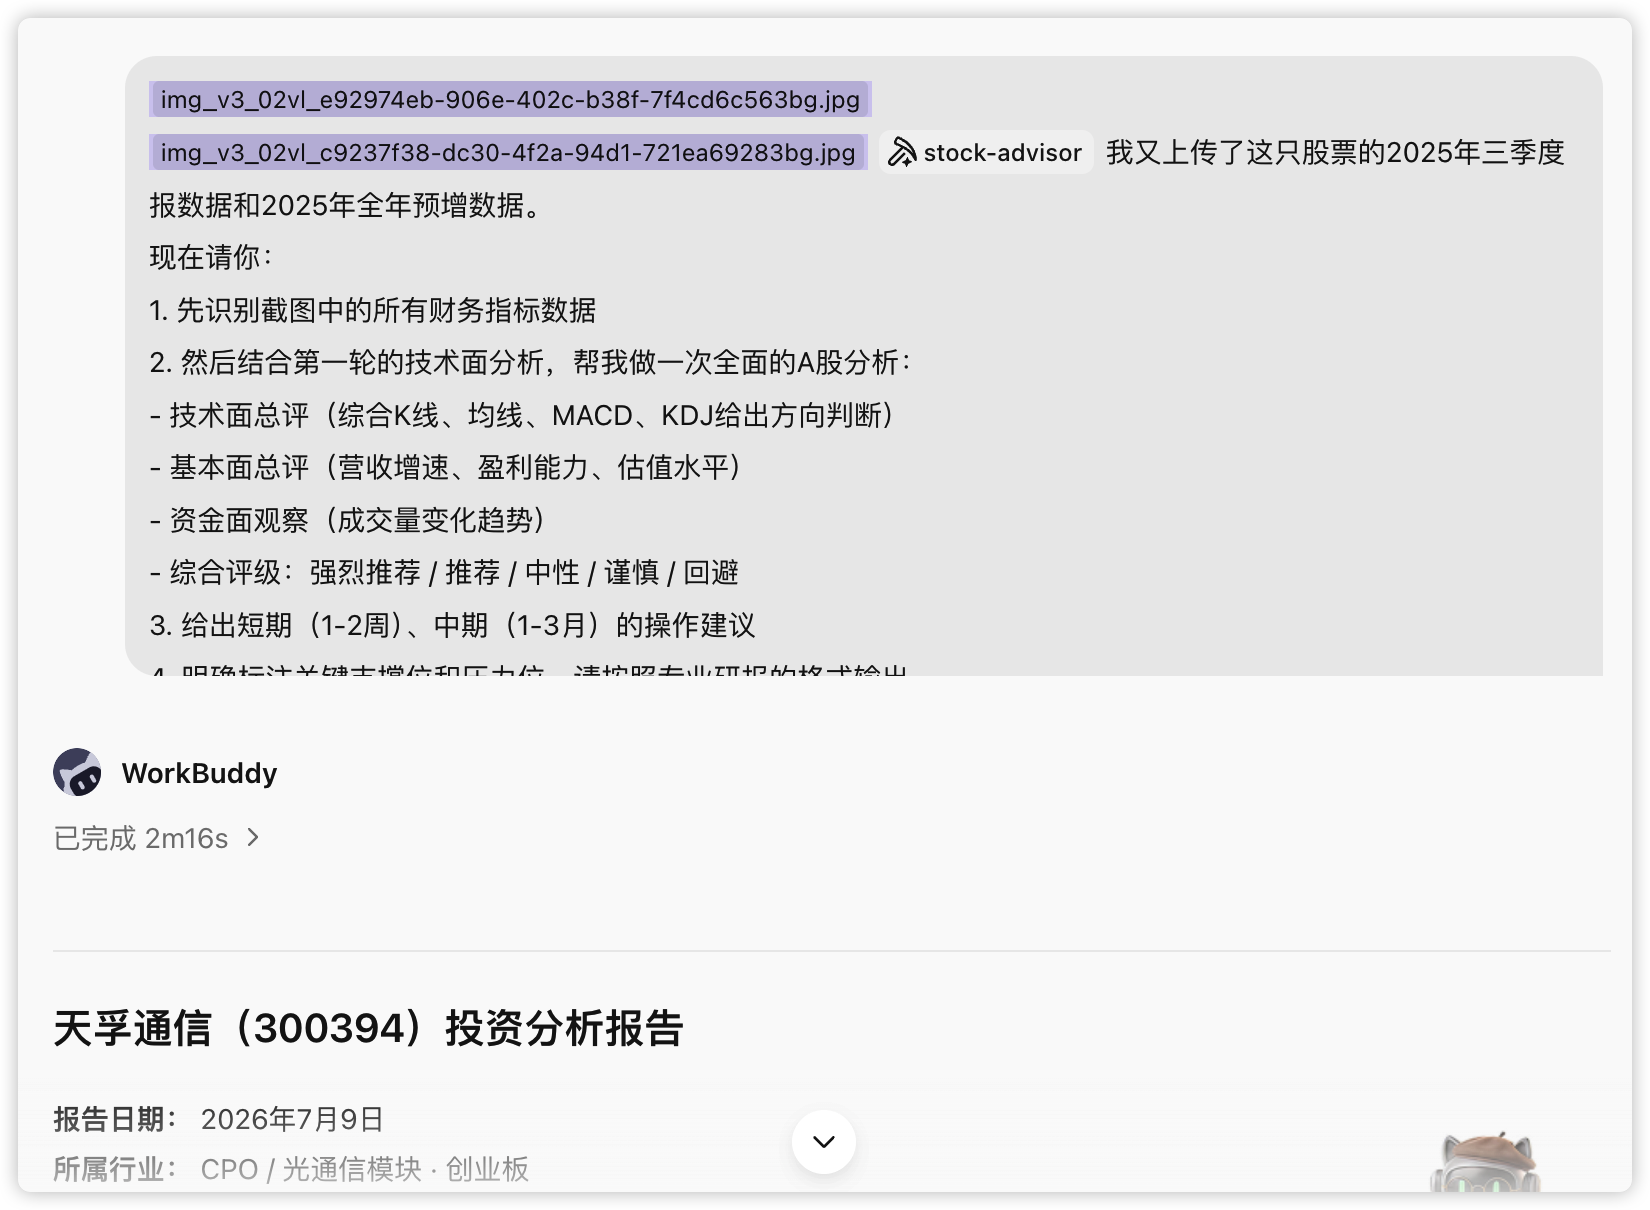
Next I uploaded screenshots of the 2025 Q3 report and the full-year pre-increase announcement, and had it fold in fundamentals for a full rating:
I've also uploaded this stock's 2025 Q3 data and 2025 full-year pre-increase data.
Now please:
1. First recognize all financial metrics in the screenshots
2. Then combining the round-1 technical analysis, do a full A-share analysis:
   - Technical overall (combine K-line, MAs, MACD, KDJ for a direction call)
   - Fundamental overall (revenue growth, profitability, valuation level)
   - Money-flow observation (volume trend)
   - Composite rating: strong buy / buy / neutral / cautious / avoid
3. Give short-term (1–2 weeks) and mid-term (1–3 months) action suggestions
4. Clearly mark key support and resistance levels; output in a pro-research-report format.
The conversation interface uploading financial screenshots + entering the prompt above.
This round it first recognized each financial metric in the screenshots (revenue 3.918B, +63.63% YoY; attributable net profit 1.465B, ROE 31.30%, gross margin 51.87%, PE 146.70…), then synthesized a composite rating table:
| Dimension | Score | Weight | Weighted |
|---|---|---|---|
| Technical | 4.0 / 5.0 | 25% | 1.00 |
| Fundamental | 4.5 / 5.0 | 30% | 1.35 |
| Valuation | 2.0 / 5.0 | 25% | 0.50 |
| Money flow | 4.0 / 5.0 | 20% | 0.80 |
| Composite | — | — | 3.65 / 5.0 |
Final rating: buy. The core conclusion is a restrained line: mid-term trend healthy (CPO boom + high growth), but short-term valuation over-extended and gains too large; don't chase; wait for a pullback. It also gave per-investor-type position suggestions, four-tier support and three-tier resistance.
The full analysis output (financial-recognition table + composite rating table + action suggestions + support/resistance).
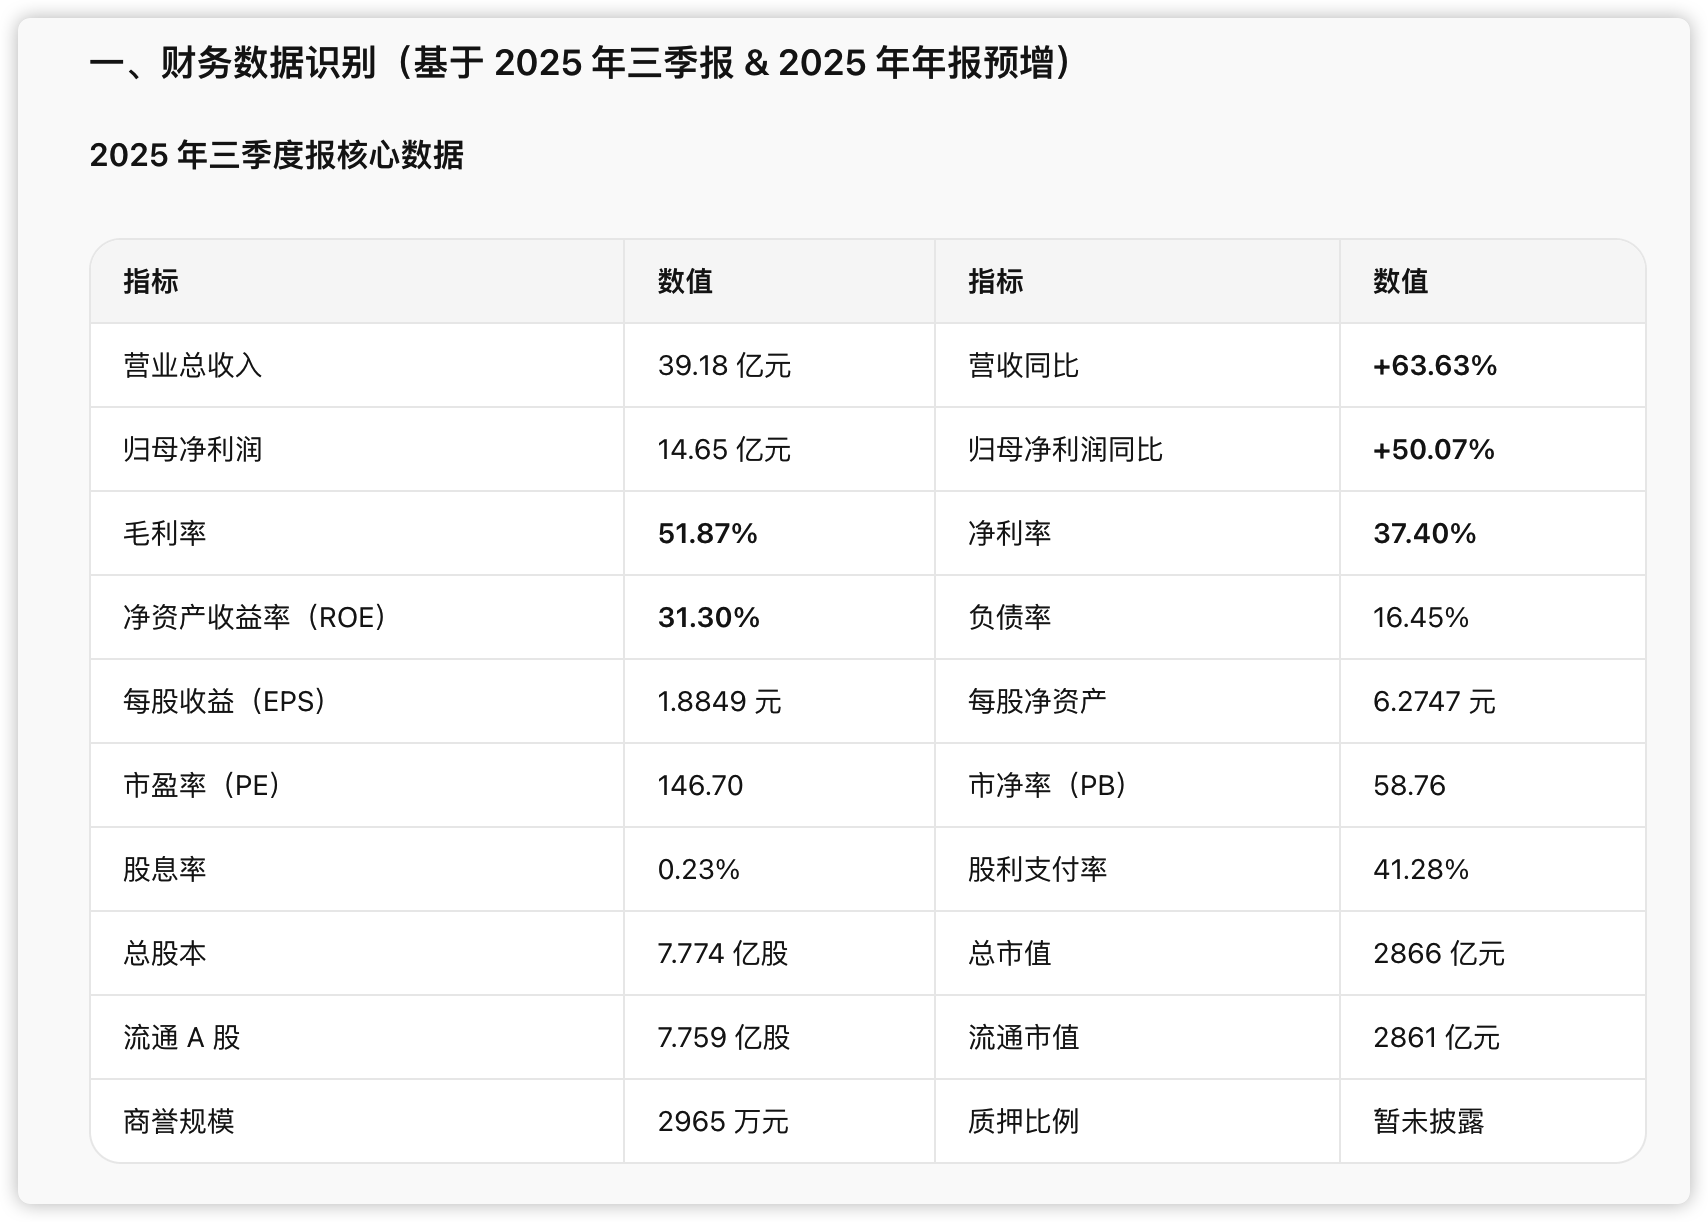
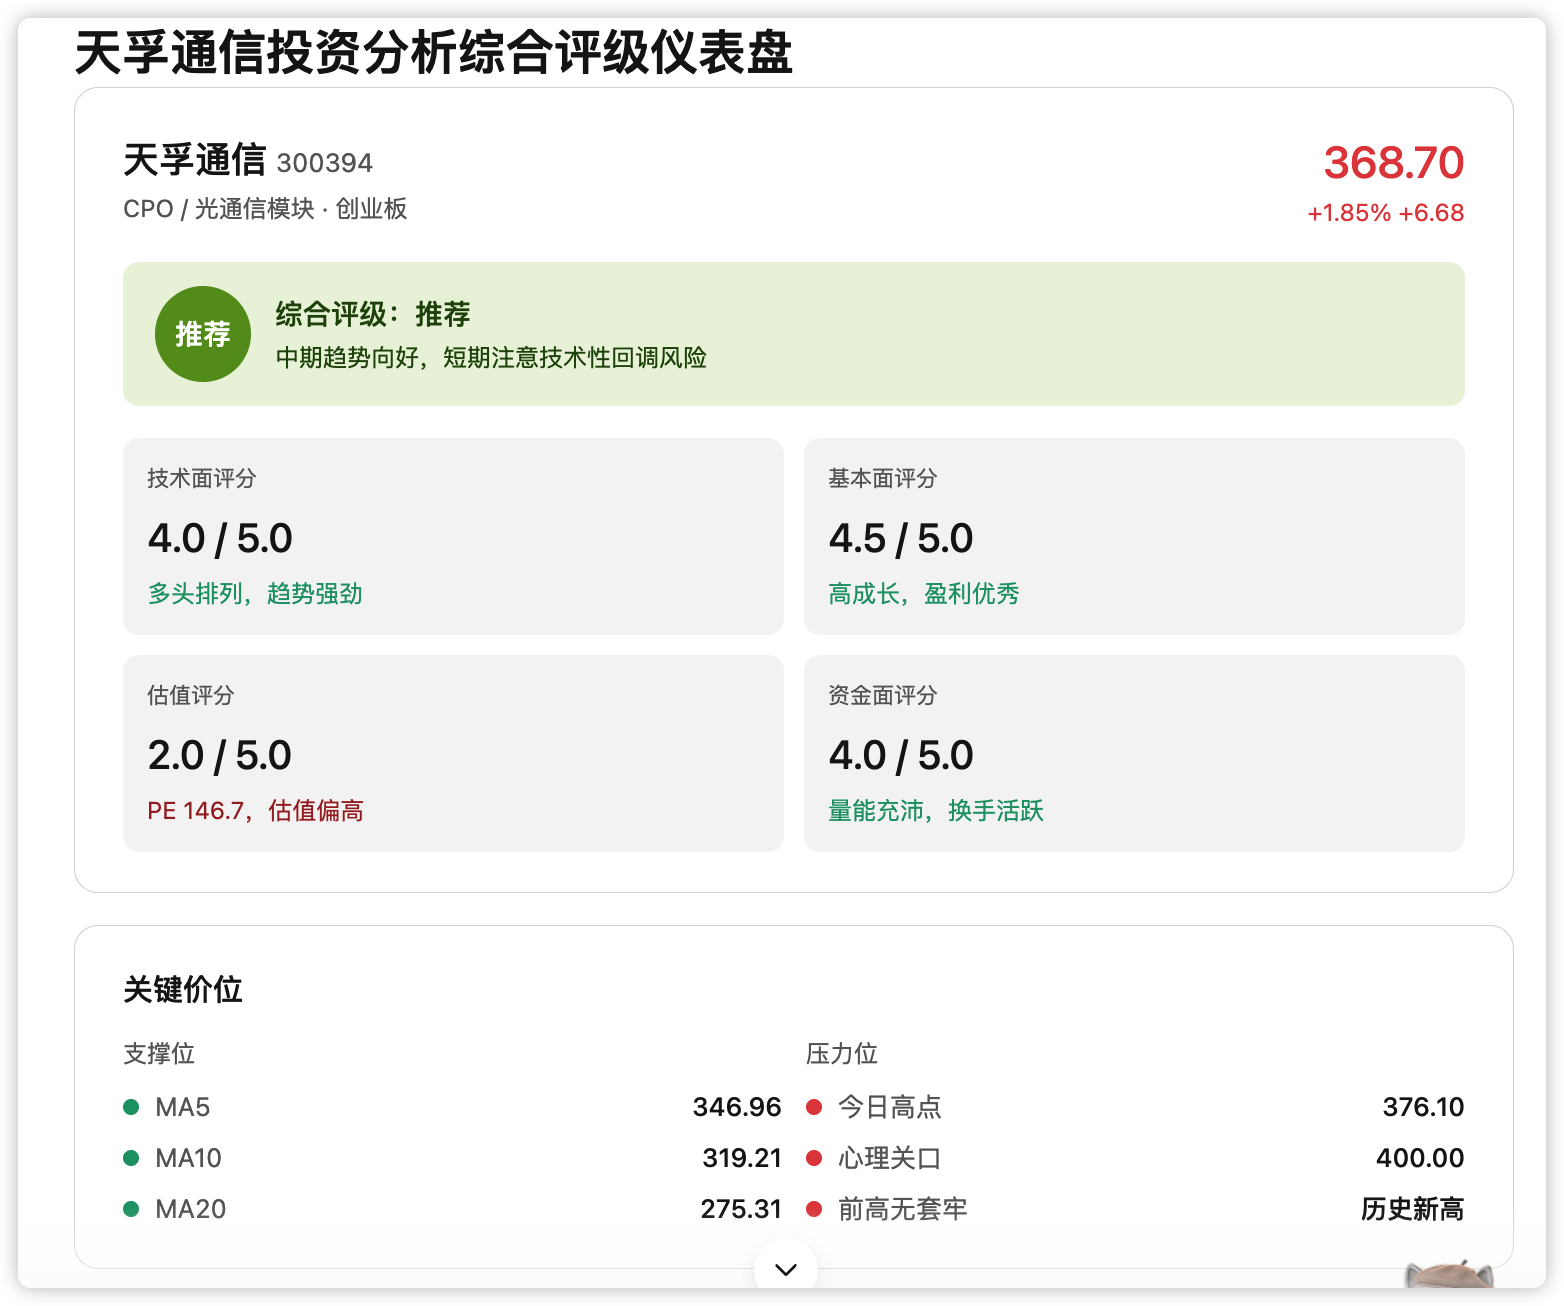
Note this step already shows module 2's design: technical, fundamental, money-flow each scored separately, then weighted; valuation too expensive gets docked from the total — no mindless bullishness just because growth is good.
You can also analyze from other angles using the a-share-analyst skill.
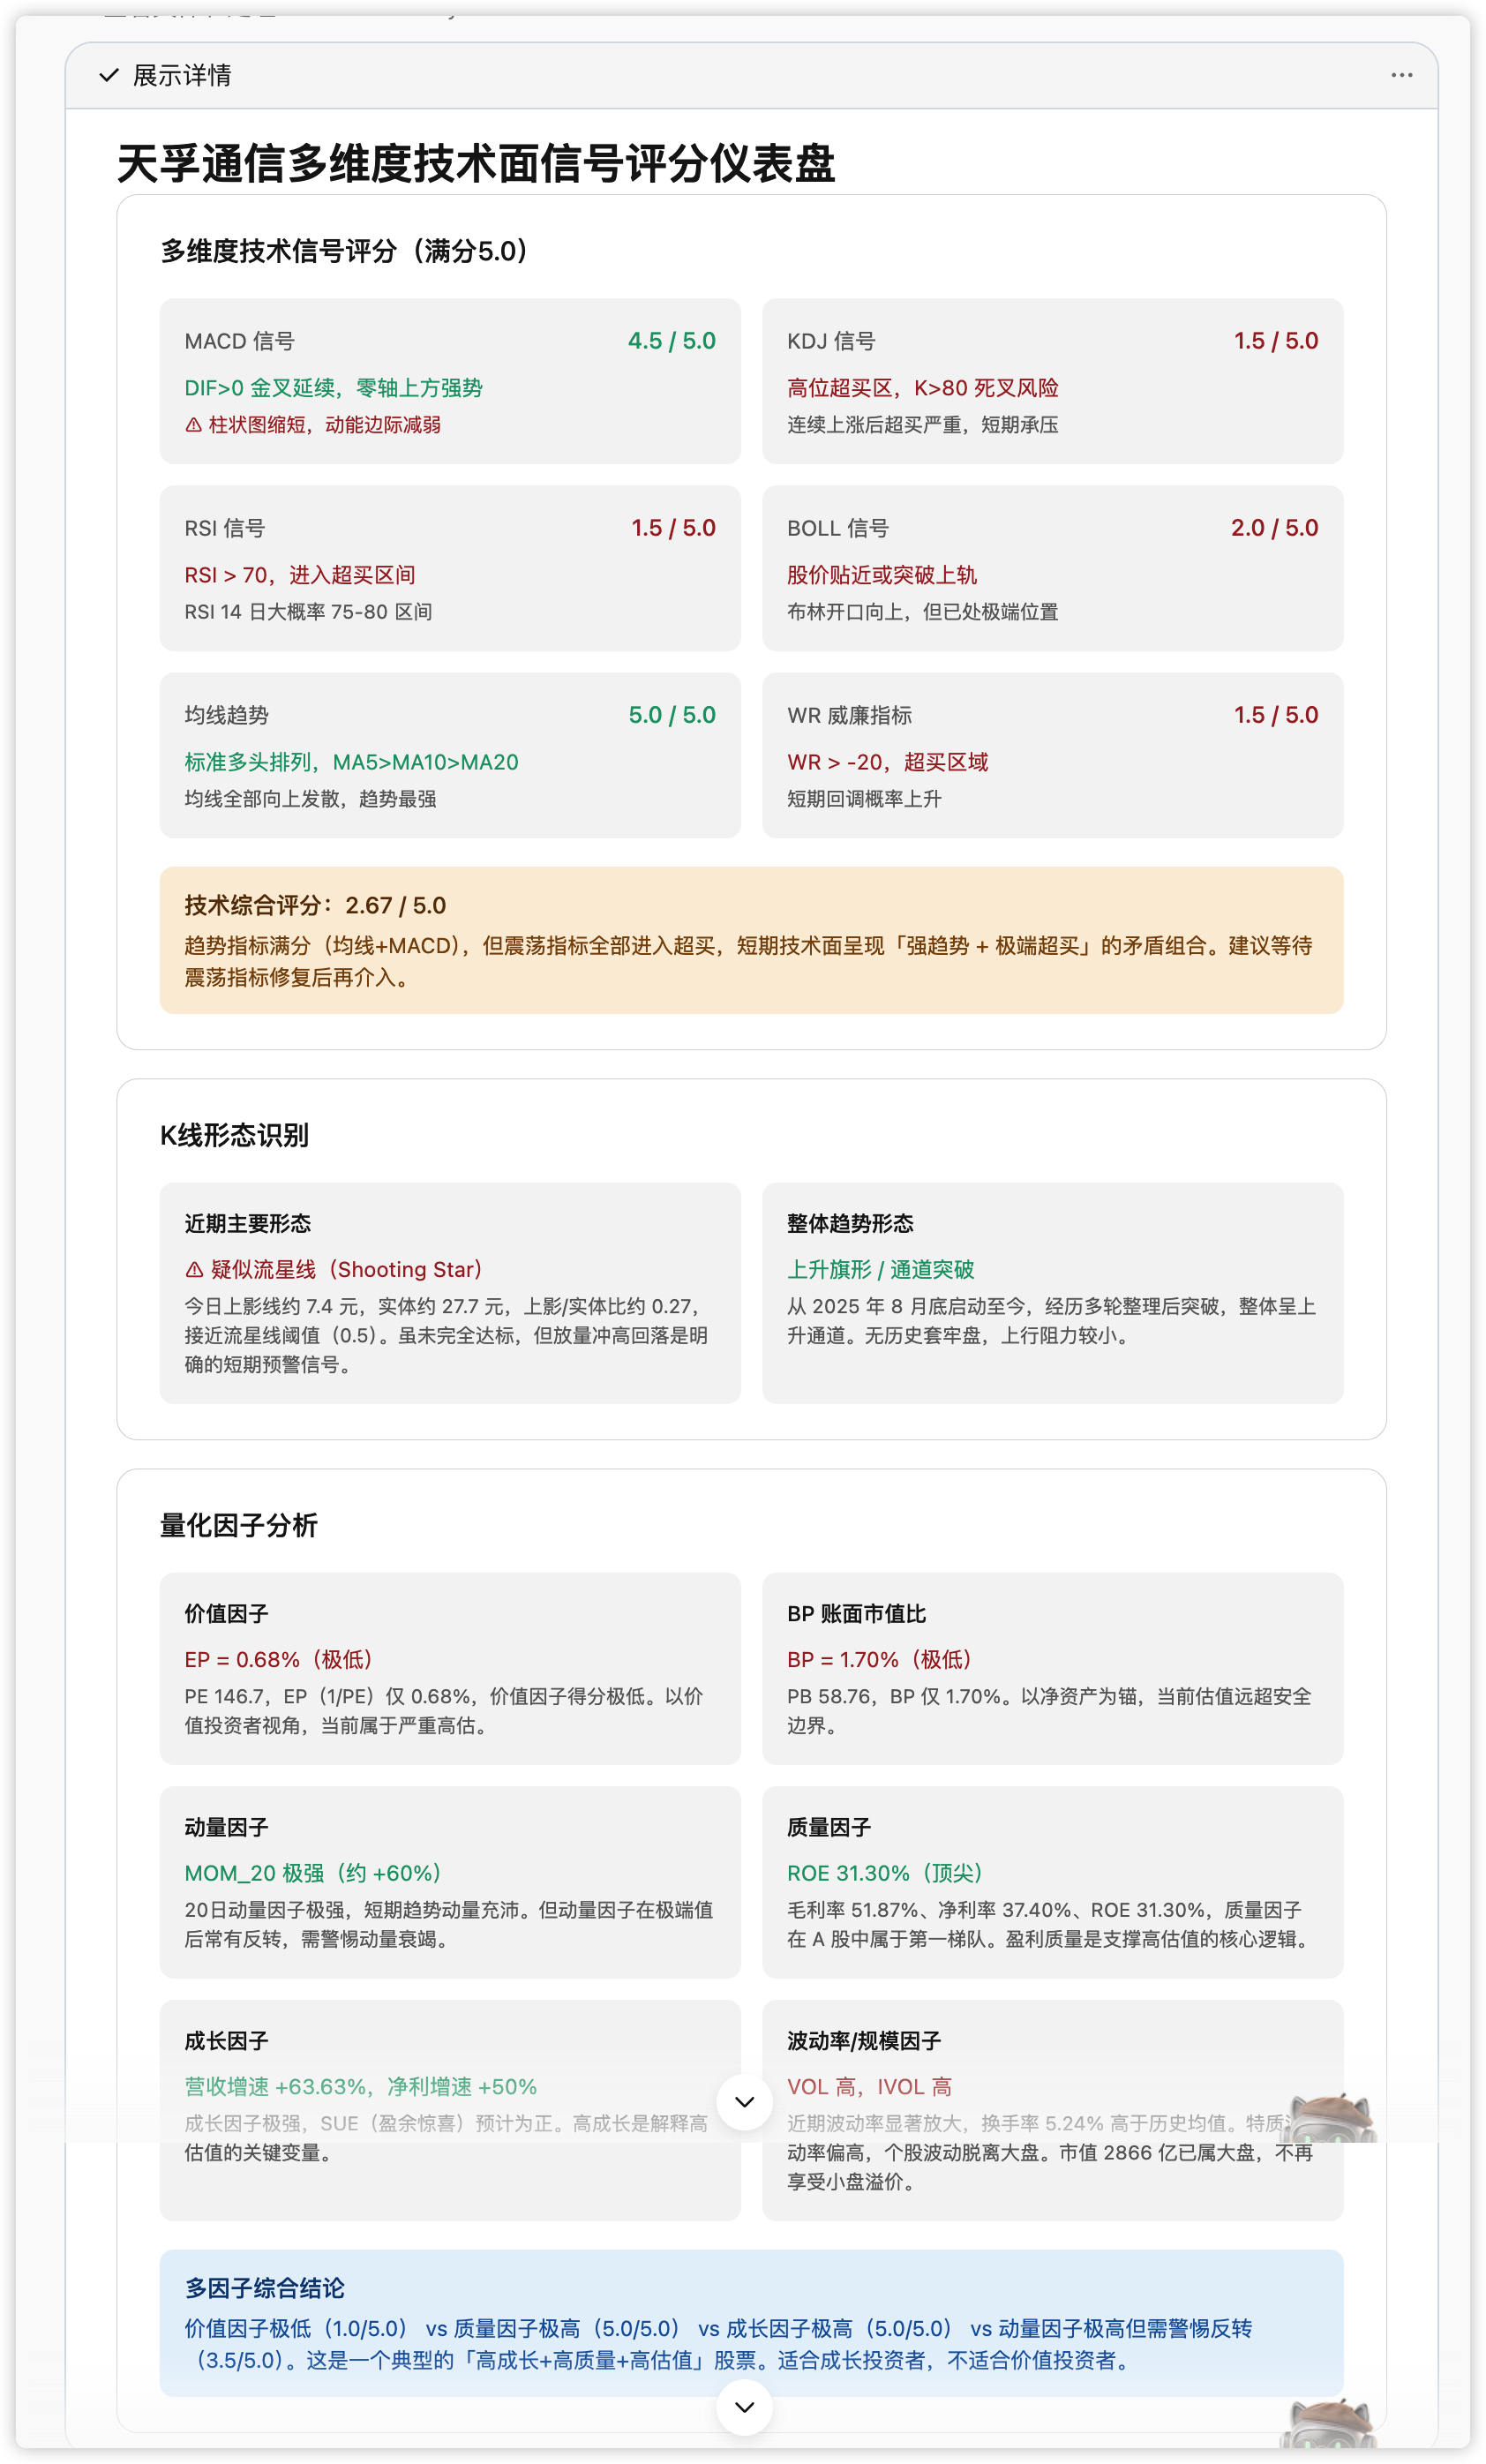
Step 3: Can't Decide? Hold a Private Board
The rating is out, but "buy" ≠ "buy now". Here I called in module four — the private board — to have four very different advisers cross-debate this stock:
But I still can't decide on this stock. Now launch a private board; I want four advisers to discuss whether it's worth investing:
- Buffett: from a value-investing angle (intrinsic value, moat, margin of safety)
- Musk: from a tech-trend and disruptive-innovation angle
- Bill Gates: from a business-model and industry-landscape angle
- Jobs: from a product-power and user-experience angle
Discussion rules:
1. Each adviser gives 3–5 minutes of independent view first.
2. Then a cross-examination round — advisers challenge each other's views.
3. Finally each gives a one-line "buy/hold/sell" final call.
4. As the host, synthesize the four into a final execution plan.
Base the discussion on the prior two rounds' data; make the advisers "talk with data".
The conversation interface launching the private board.
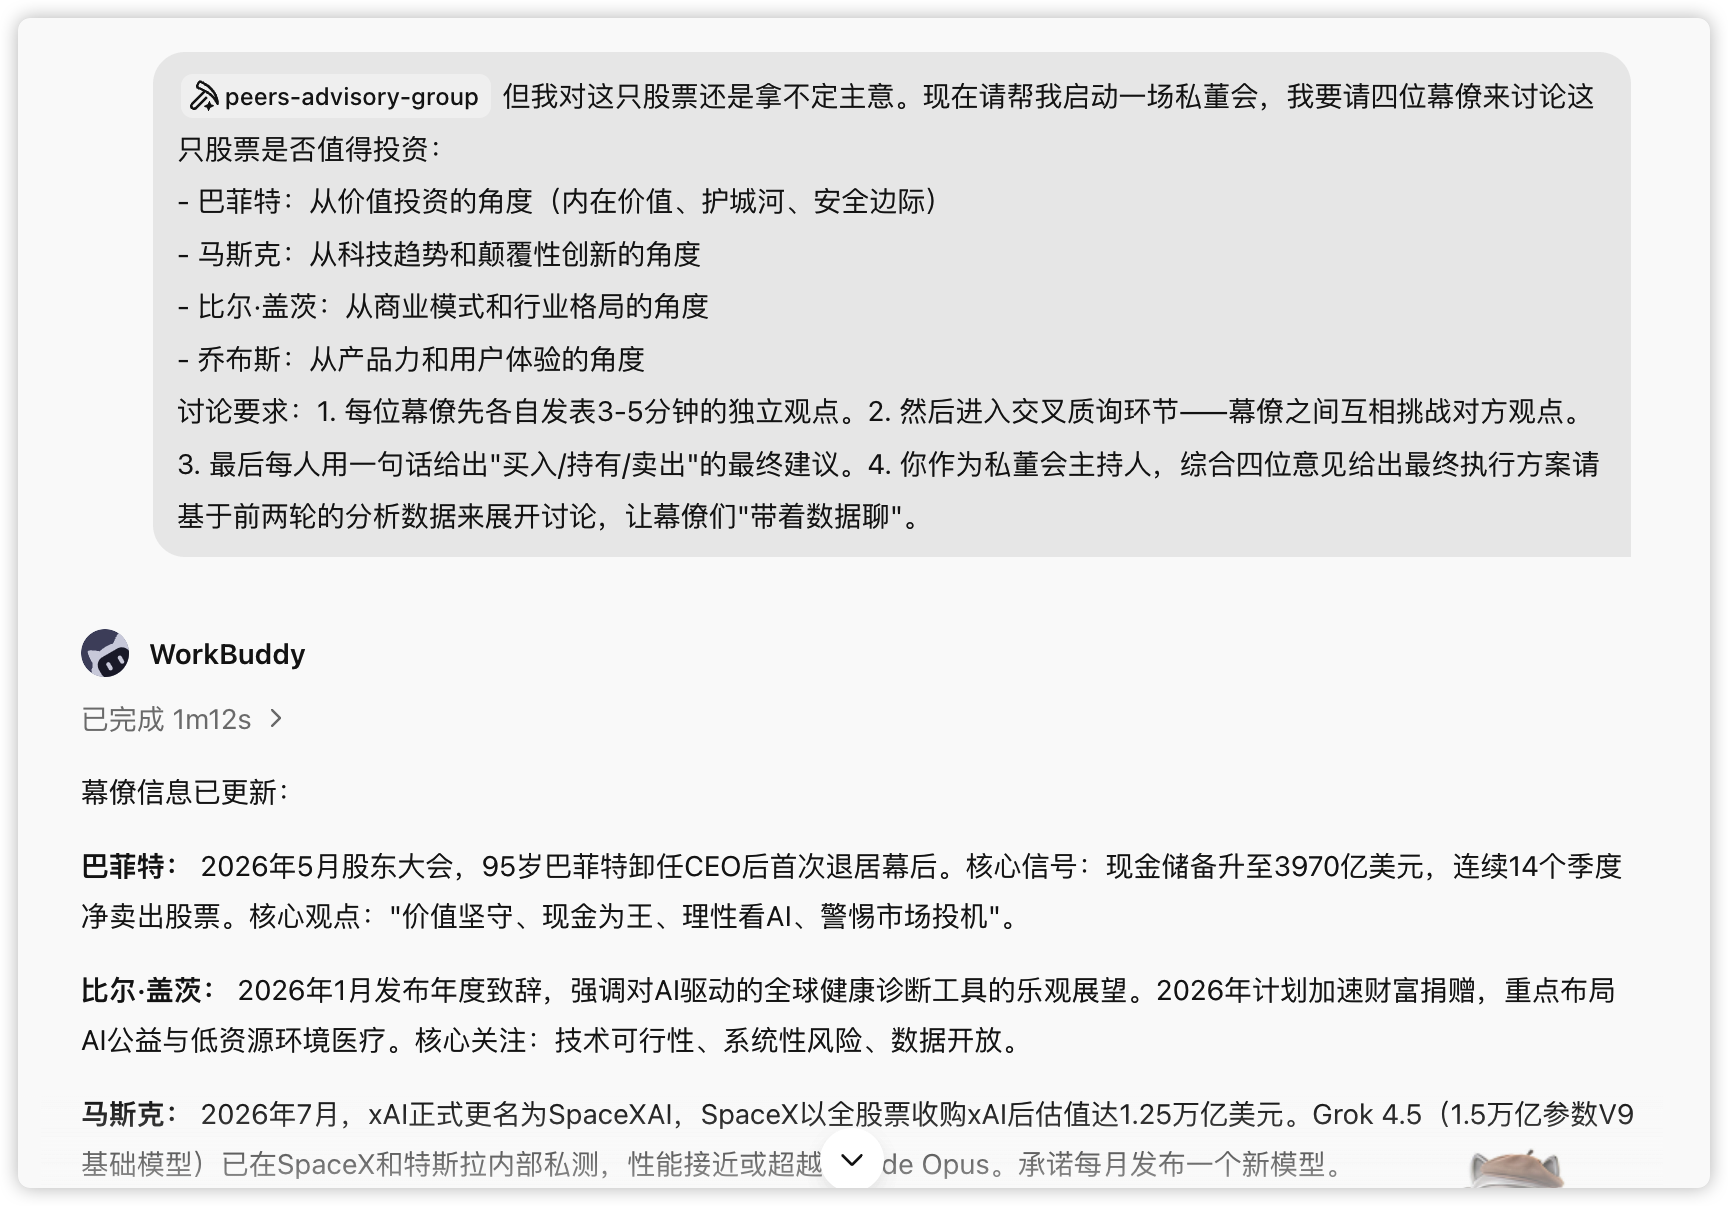
In the private-board phase, the system first updated the four advisers' recent news online, and ran extra searches for fresher data (2025 full-year revenue 5.163B, net profit 2.017B, 2026 Q1 down QoQ, plus horizontal comparison with Zhongji Innolight and Eoptol) — exactly module 3 "multi-dim cross-validation" at work, pushing the discussion from screenshot data to the latest web facts.
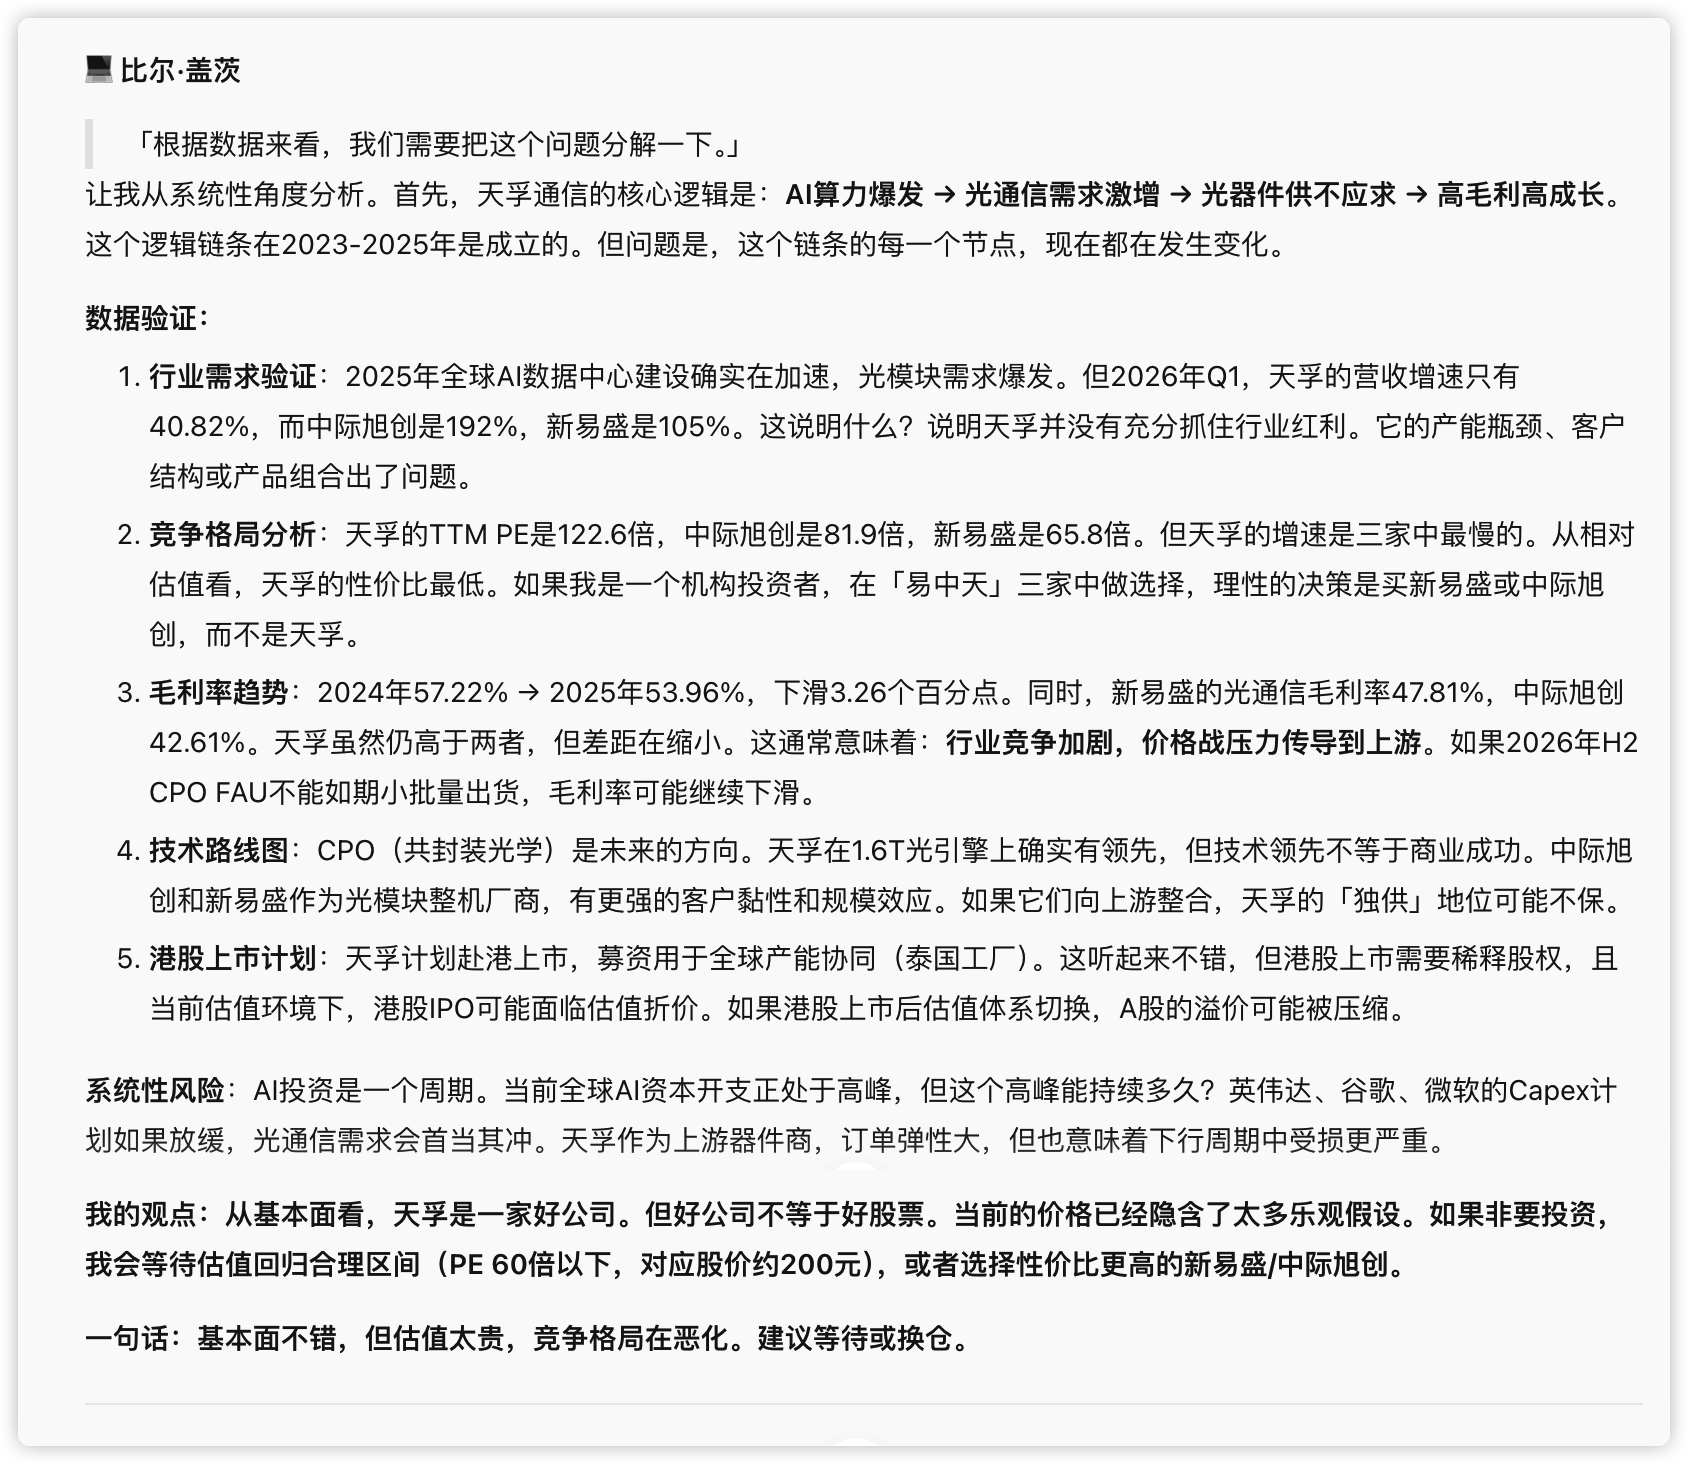
The four advisers spoke independently, then cross-examined; views quickly split into two camps:
Four advisers' independent views +
Cross-examination round (long; split-screen recommended).
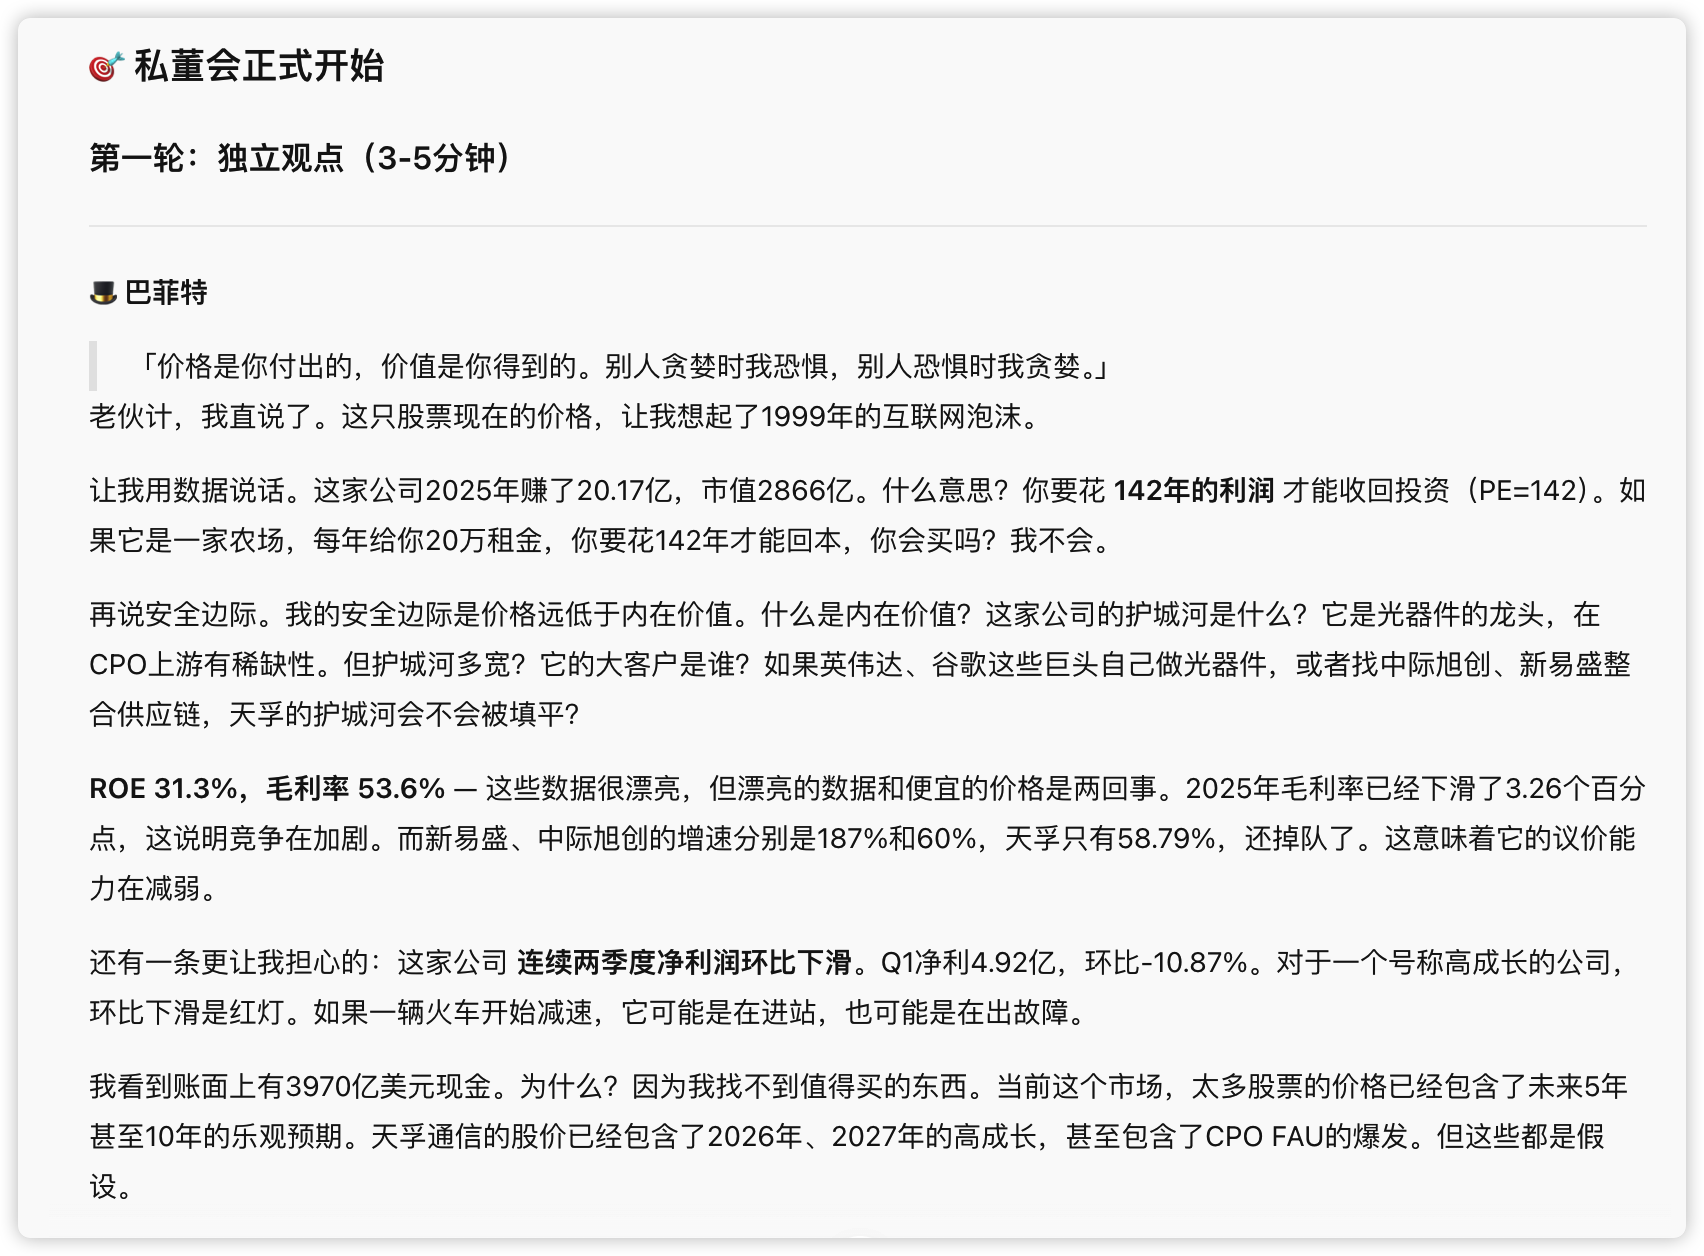
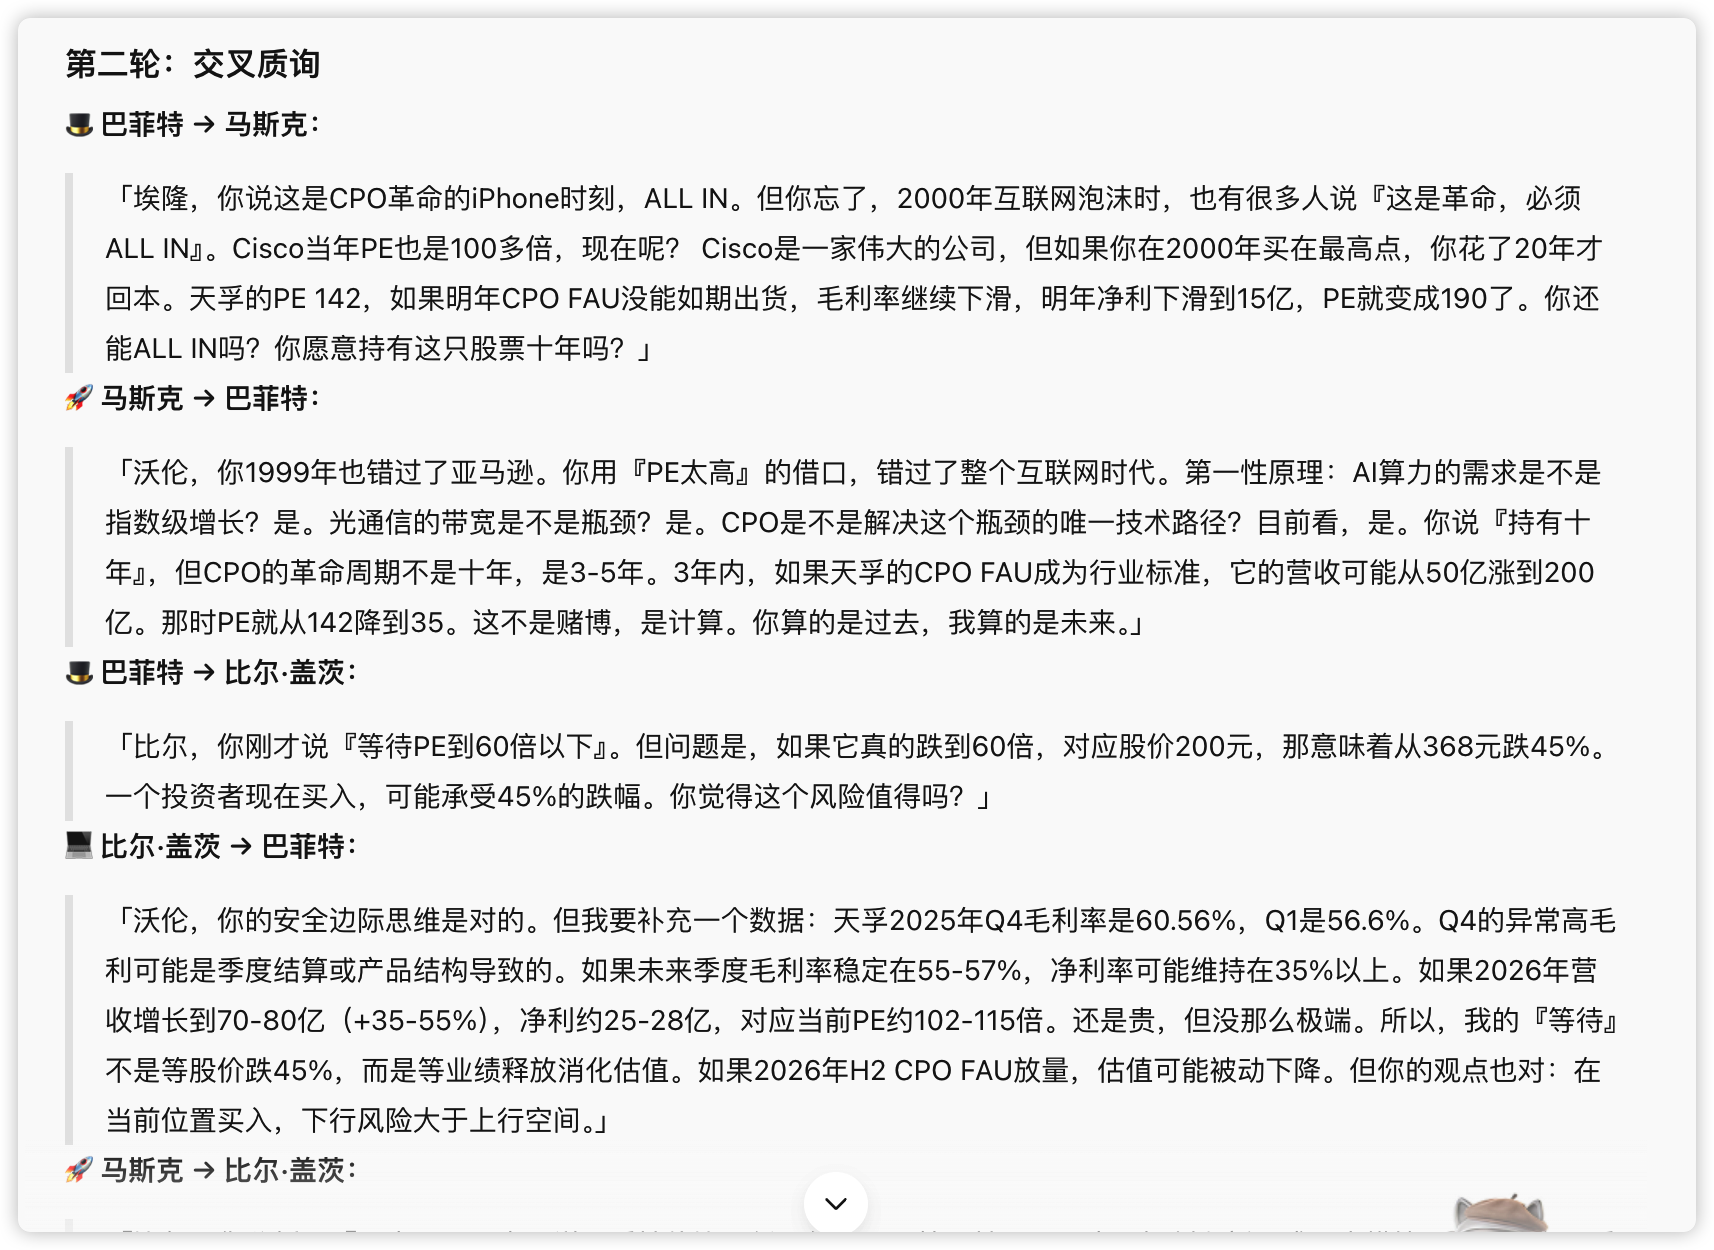
Finally each one-liner set the tone, forming a sharp "2:2" split:
- Buffett (avoid): "PE 142, zero margin of safety, moat narrowing. Below 200 RMB this isn't investing, it's gambling."
- Bill Gates (wait / rotate): "Fundamentals OK, but valuation too rich, competitive landscape worsening. Wait for PE below 60, or rotate to better-value Eoptol / Innolight."
- Musk (All in): "CPO is the iPhone moment of optical comms; Tianfo is the upstream shovel king. Overbought is the last boarding chance, not a reason to get off."
- Jobs (conditional hold): "If you believe in the CPO revolution, hold now — but only if CPO FAU lands in 2026 H2 as scheduled; otherwise exit decisively."
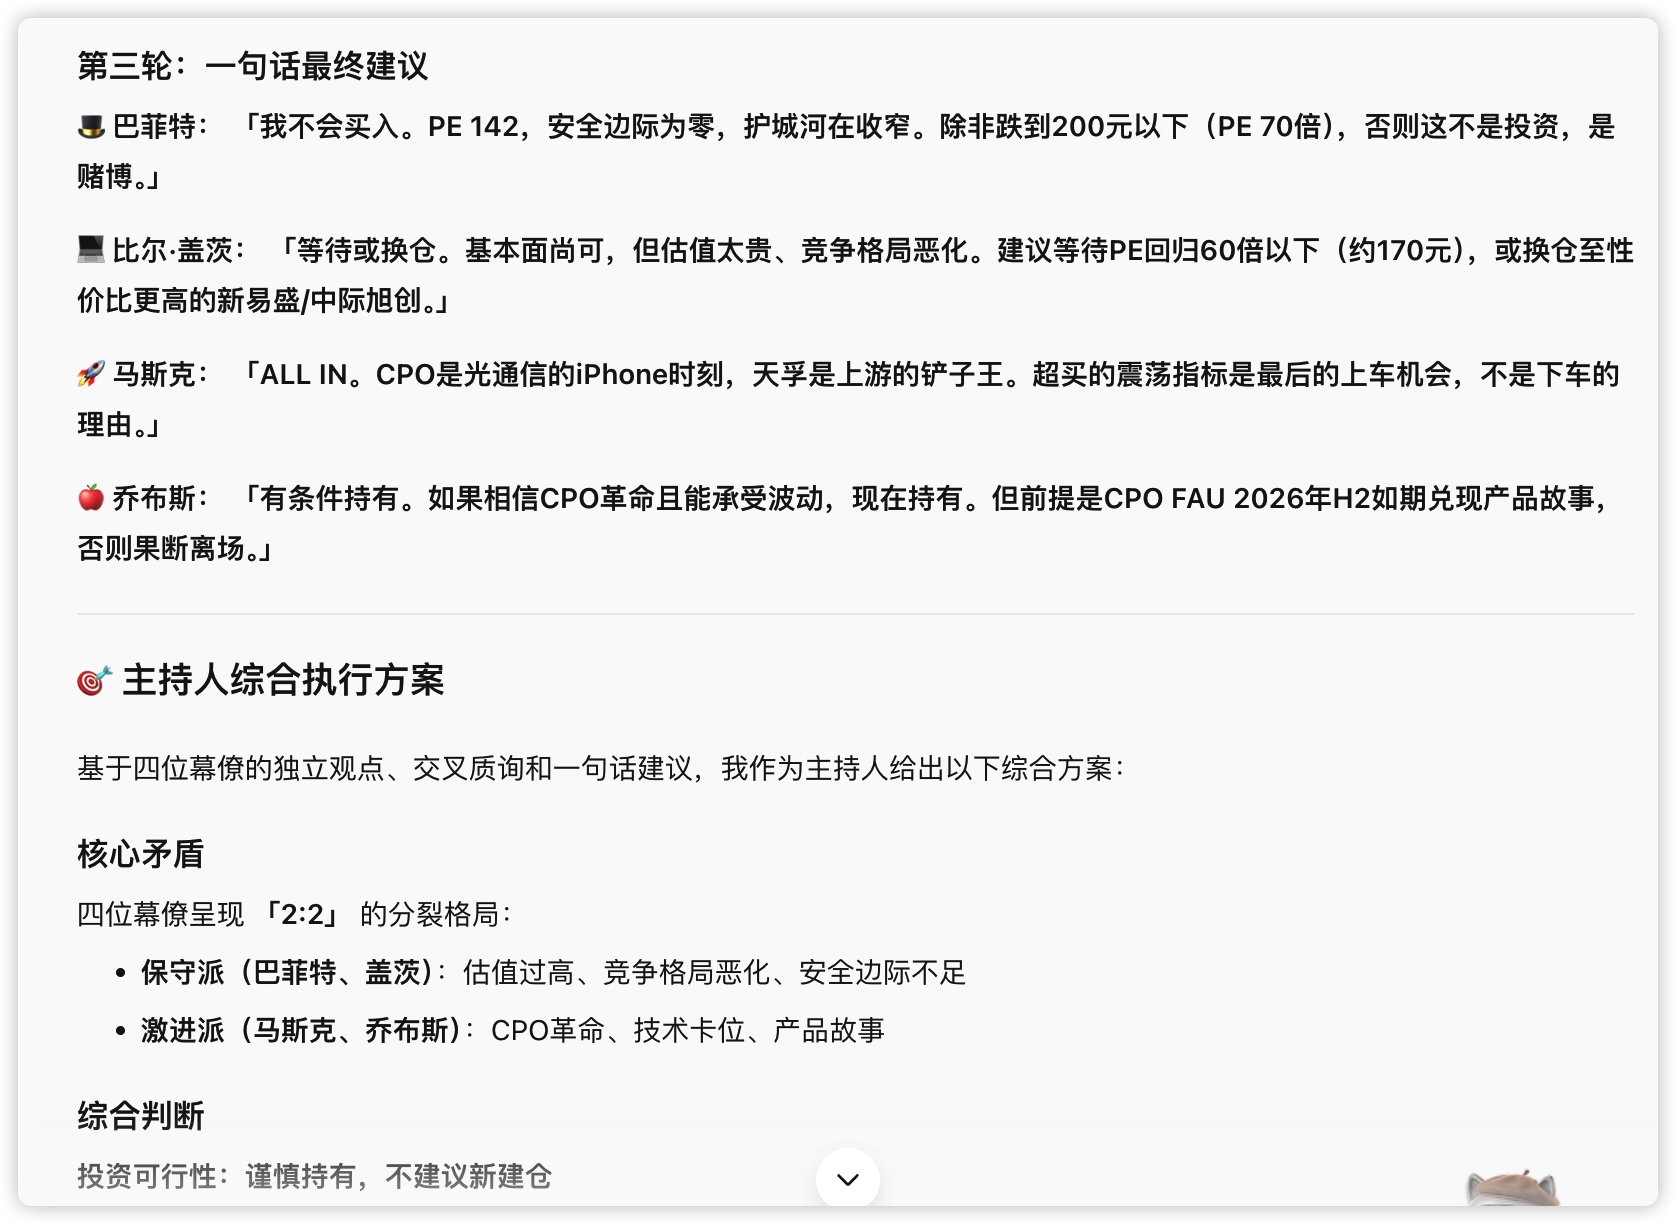
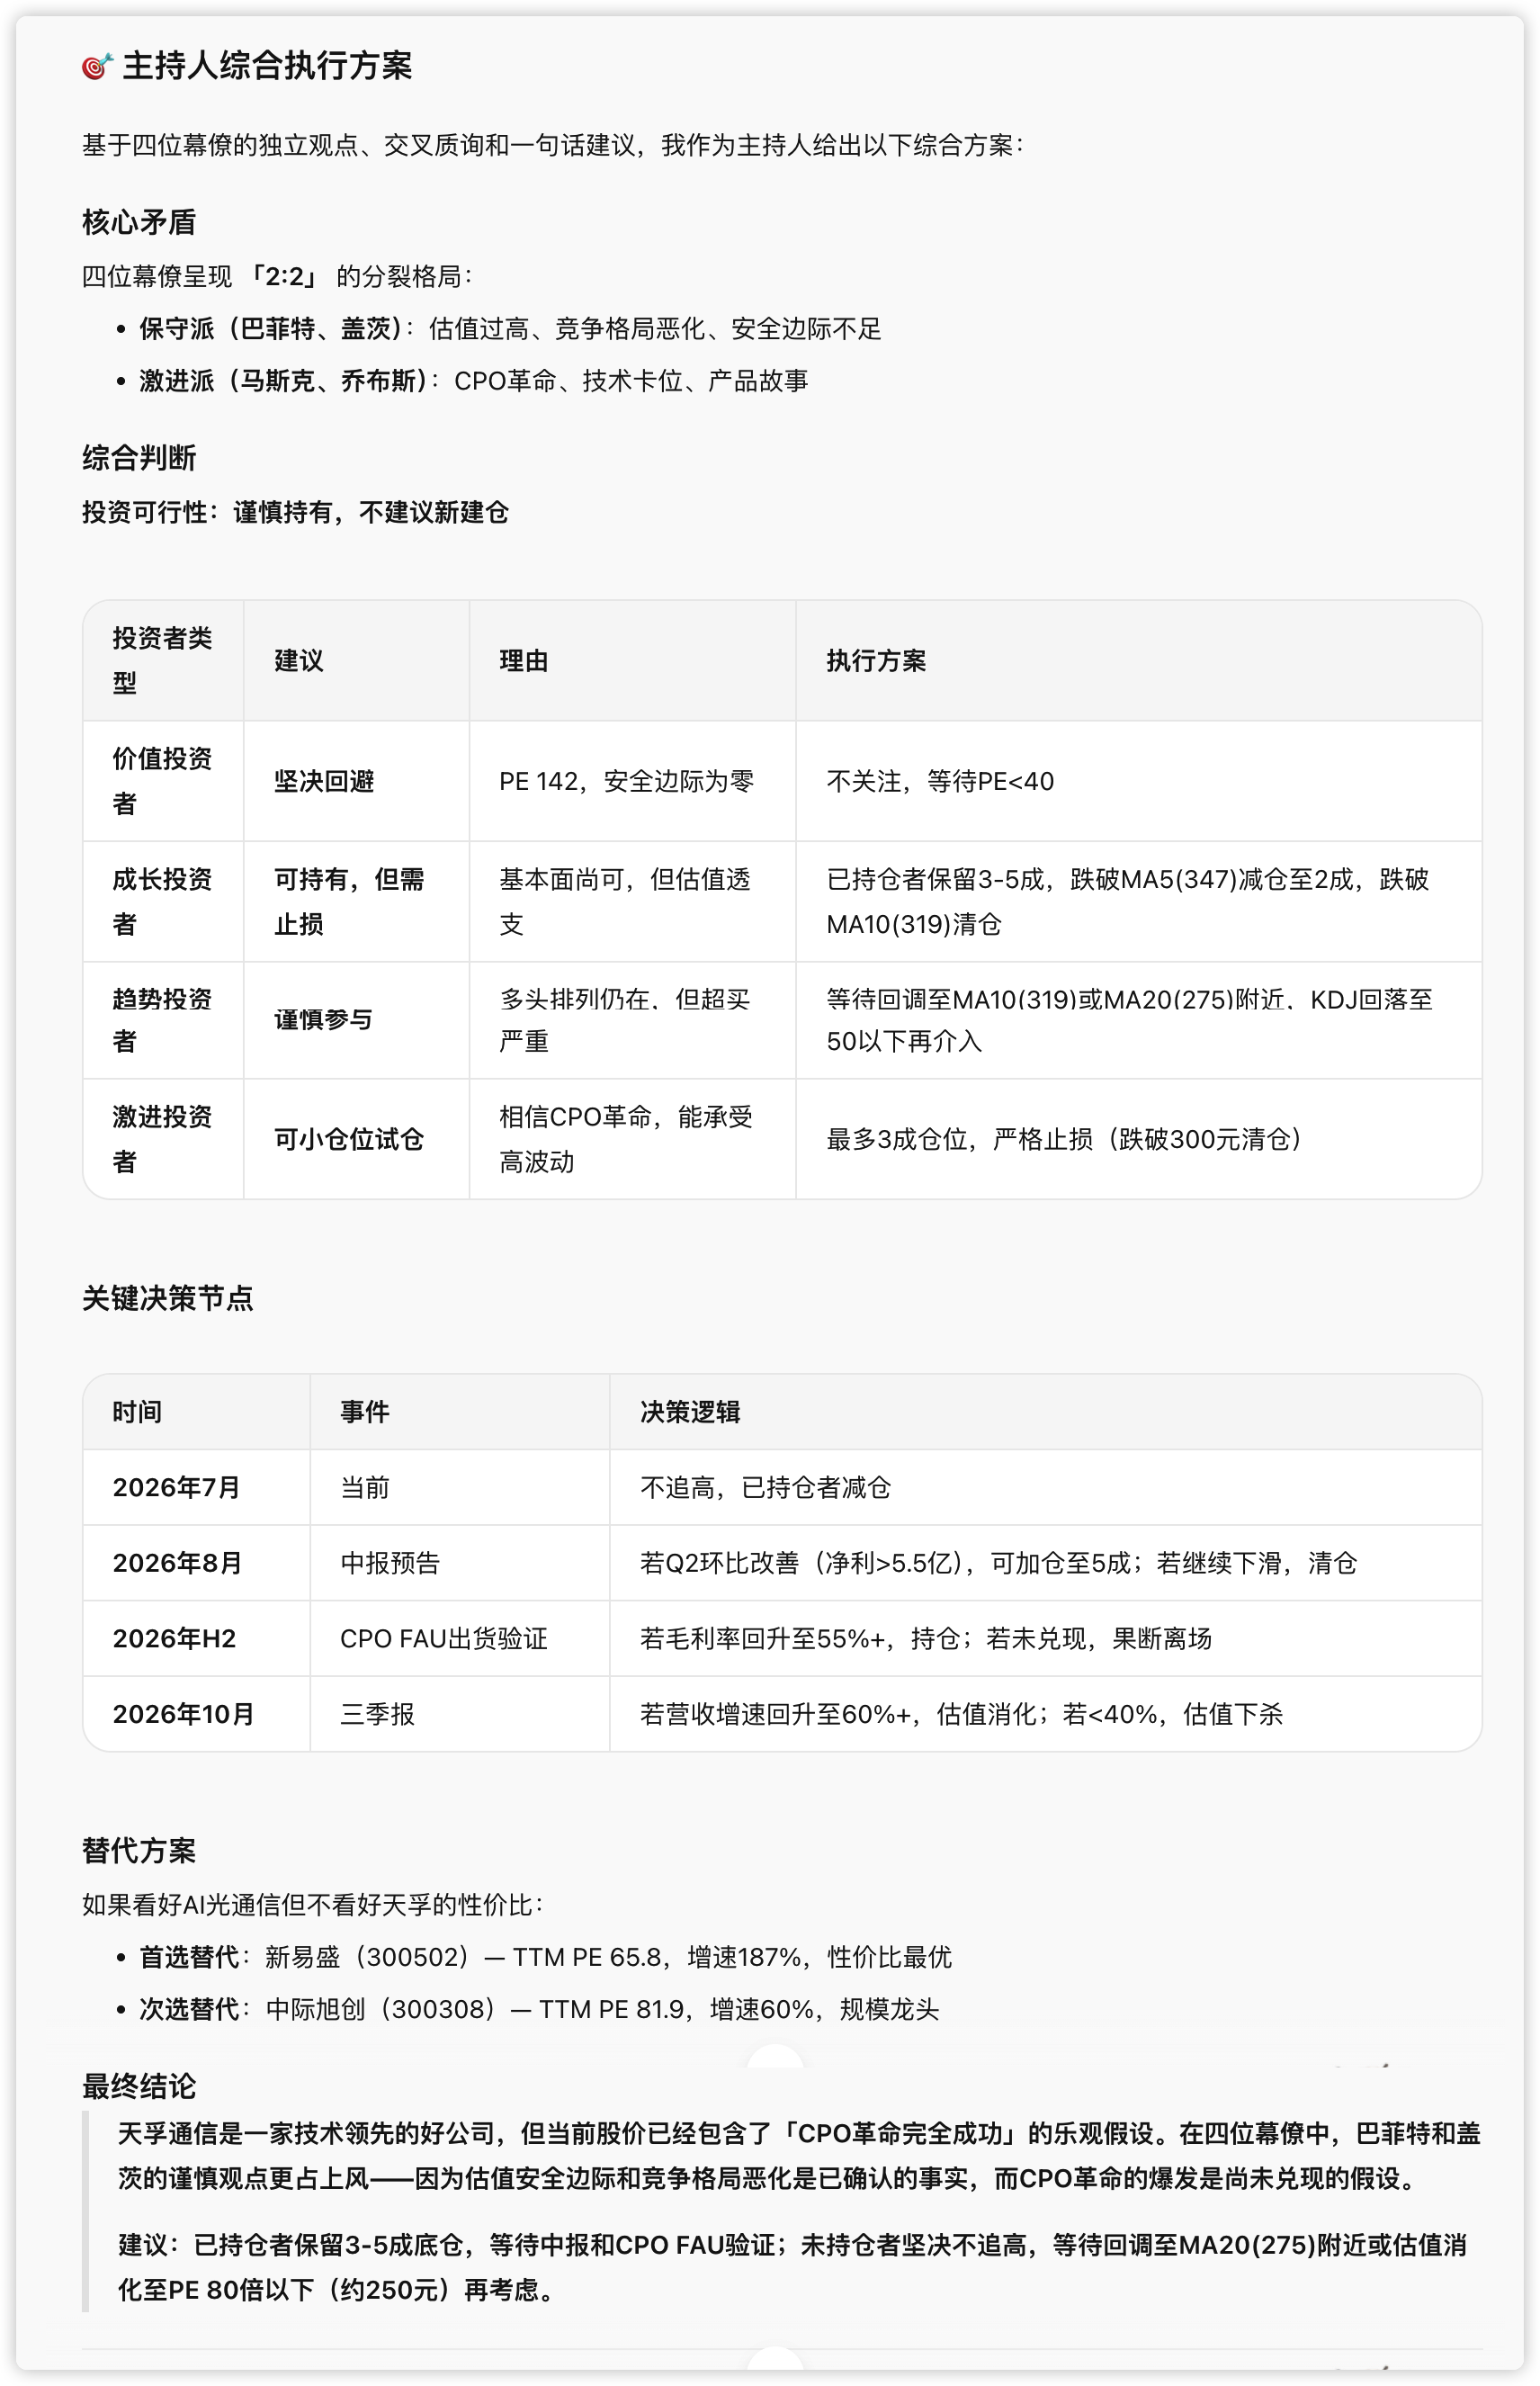
The host finally synthesized a per-investor-type execution plan, not a blanket "buy or not":
| Investor type | Advice | Execution points |
|---|---|---|
| Value investor | Firmly avoid | Wait for PE < 40 |
| Growth investor | May hold, with stop-loss | Keep 30–50%, cut below MA5(347), clear below MA10(319) |
| Trend investor | Cautious participation | Wait for pullback to MA10/MA20, KDJ below 50 before entering |
| Aggressive investor | Small trial position | Max 30%, clear below 300 RMB |
And hung the decision on a few future verification nodes: Aug mid-year preview for Q2 QoQ improvement, H2 for CPO FAU volume and gross margin back to 55%+, Oct Q3 for revenue growth. Logic falsified → exit.
The host's composite execution plan (per-type advice table + decision-node table + alternative targets).
Finally: One-Click to a Finished Report
After the conversation, have it generate the whole analysis as a magazine-style report; stock-advisor calls the layout module to produce the artifact, savable as a local PDF or uploaded straight to Feishu cloud docs.
The magazine-style investment-analysis report artifact (first screen / cover).

Looking back at this case, stock-advisor turned the eight loose prompts of section 2 into a complete research run in three conversational rounds: read chart → read financials → private board → report. And all along it didn't make that most key decision for me — buy or not. It just looked at what should be looked at, argued what should be argued, and cleanly handed the judgment back to me.
Common Mistakes and Usage Boundaries
Finance is a strongly regulated, strongly risky scene; it needs firmer boundaries than the office suite. A few pitfalls below are the most common when applying AI to investing.
| Common mistake | Why it's wrong | Right approach |
|---|---|---|
| Have AI give "buy/sell points" | It doesn't hold full real-time info, and isn't responsible for your money | Use it only for fact-tidying and bull/bear reasoning; you call the buy/sell |
| Fully trust screenshot-recognized numbers | Image recognition misreads; financial-scope changes | Cross-verify key numbers — in this case the private-board data was fresher than the first two rounds |
| Expect it to call industry turning points, price bottoms | These need forward info and experience AI can't give | Have it lay out "which leading indicators to watch"; you watch the turning point |
| Read only bull logic, getting hyped | Confirmation bias; AI reinforces your tone | Use Prompt 6 and the private board to force bear logic and counter-evidence |
| Use the AI report directly as investment basis | The report is research aid, not investment advice | Report conclusions are for reference; the decision and risk are yours |
Risk warning: the stock market carries risk; invest cautiously. All prompts, Skills and cases in this chapter are for "research aid" purposes and do not constitute any investment advice. AI is only a tool that puts facts and divergence in front of you; the final judgment and consequences are always on the human side. Act on this at your own risk.